METHODOLOGY

How We Identify These Picks

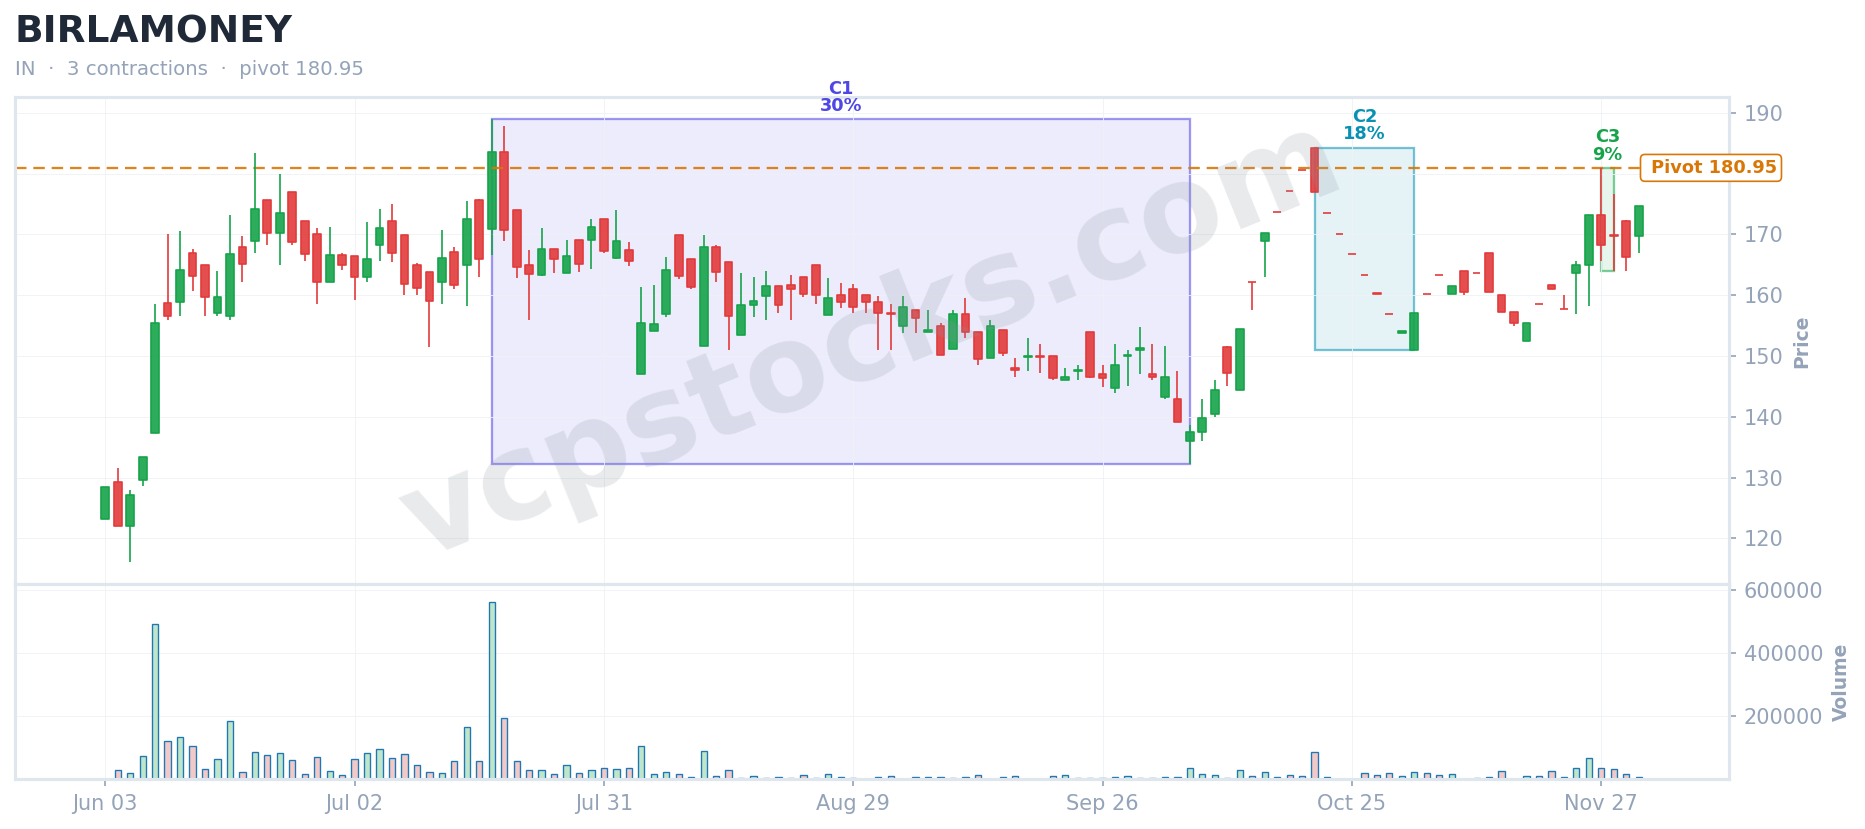
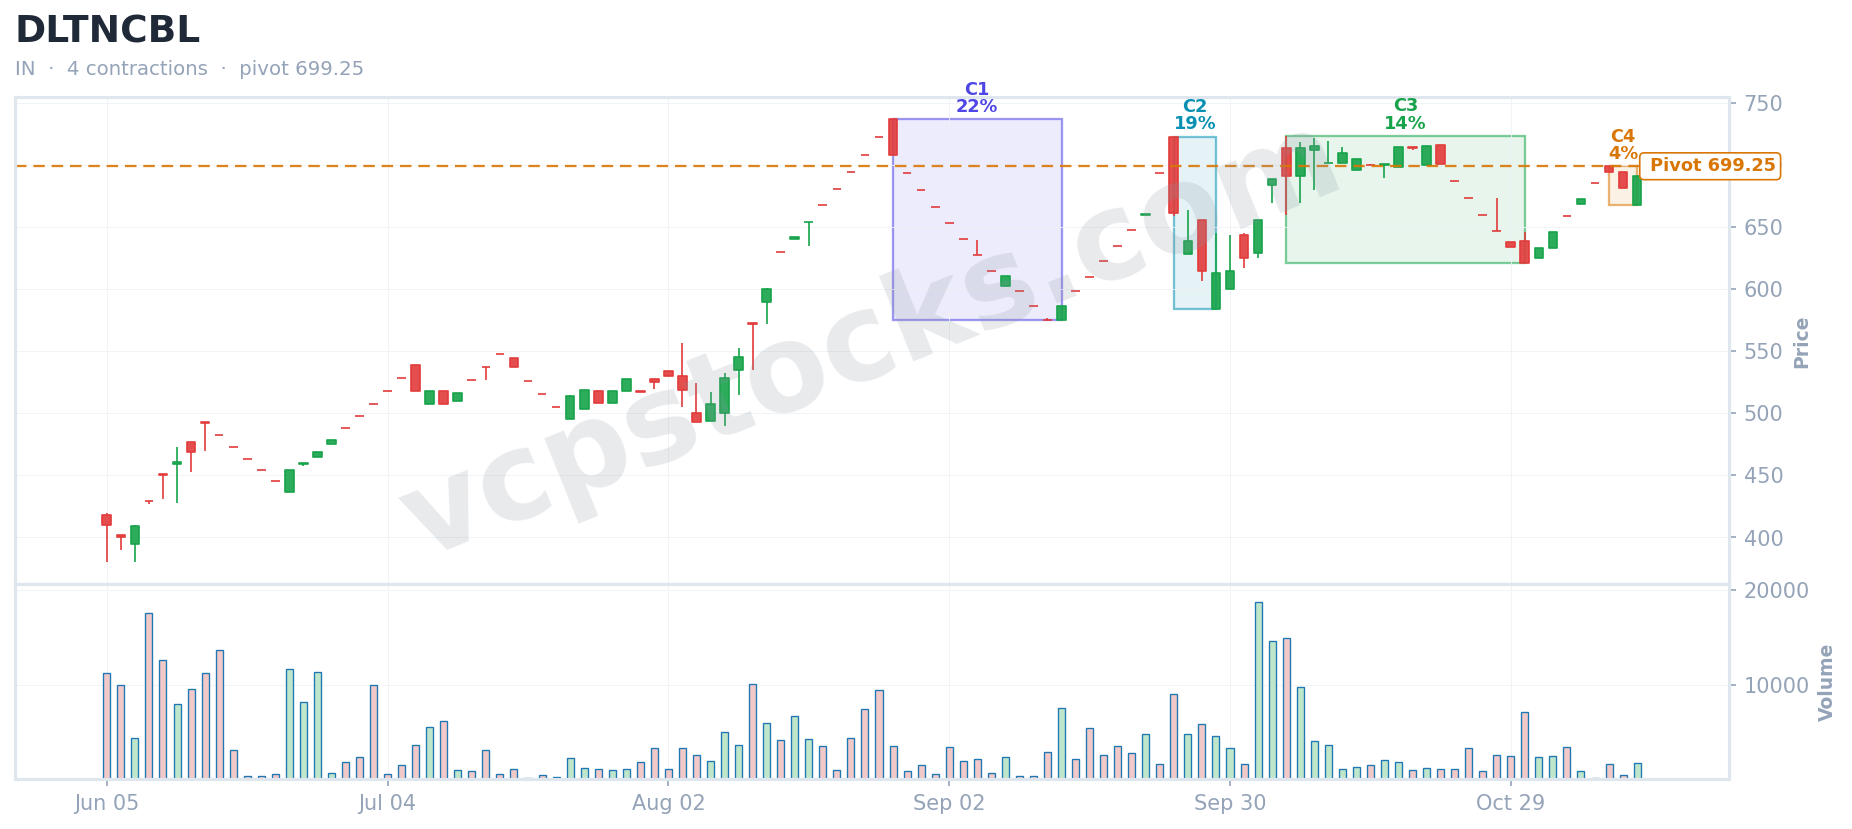
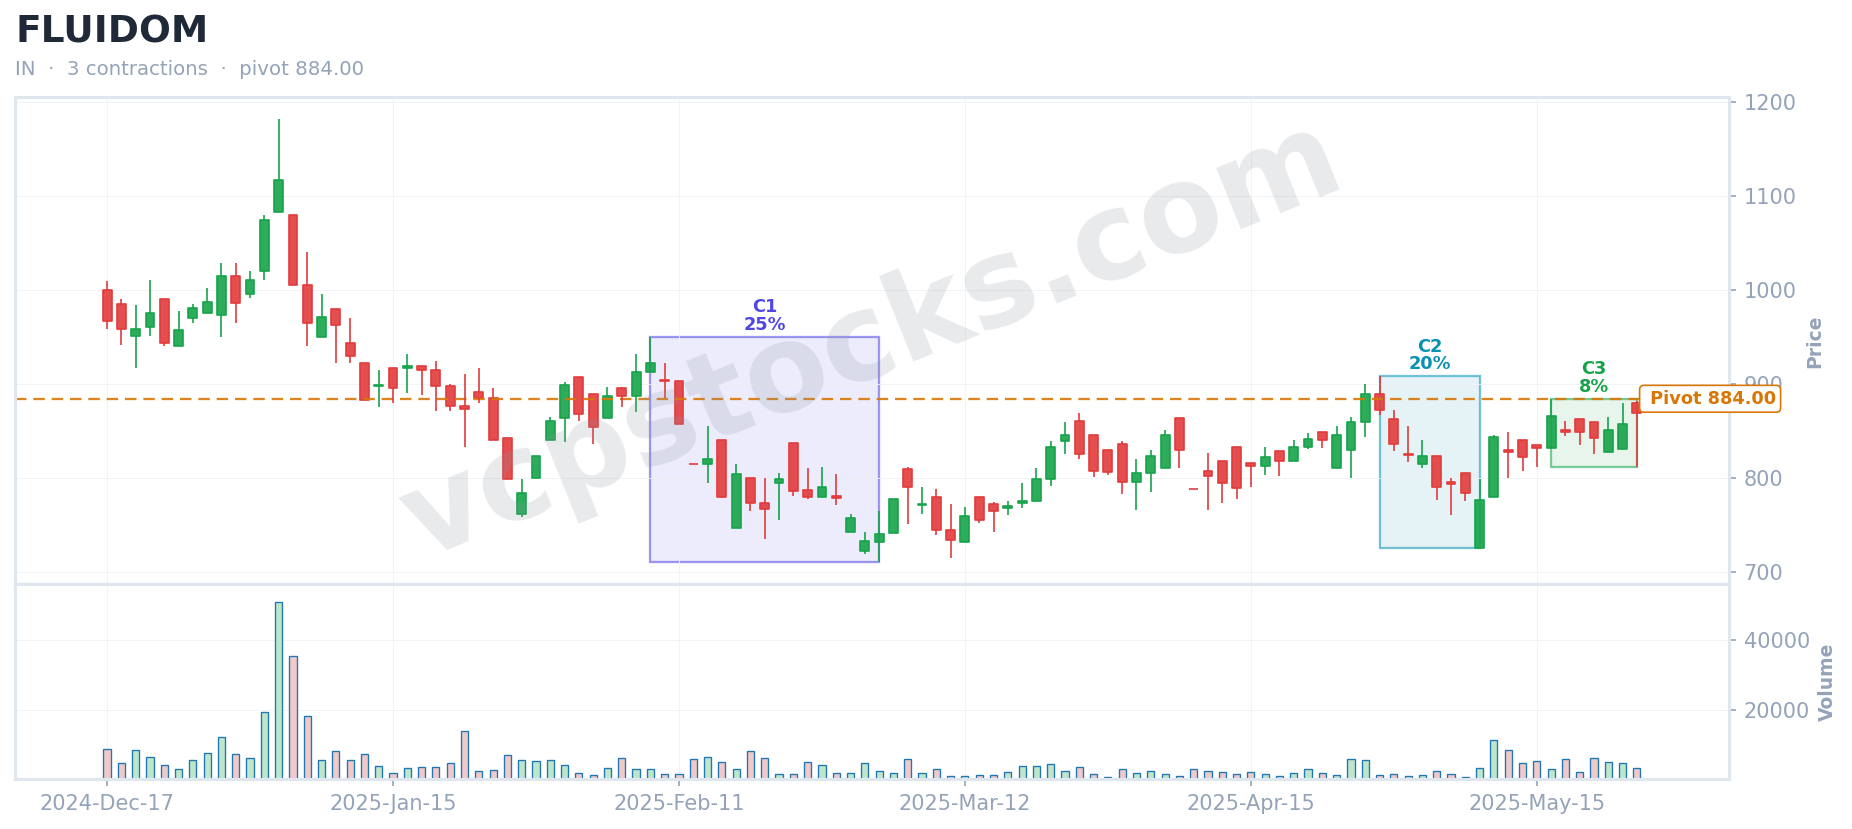
Every pick followed the same repeatable algorithm — no gut feel, no manual guessing.

1

Screener Flags the Pattern

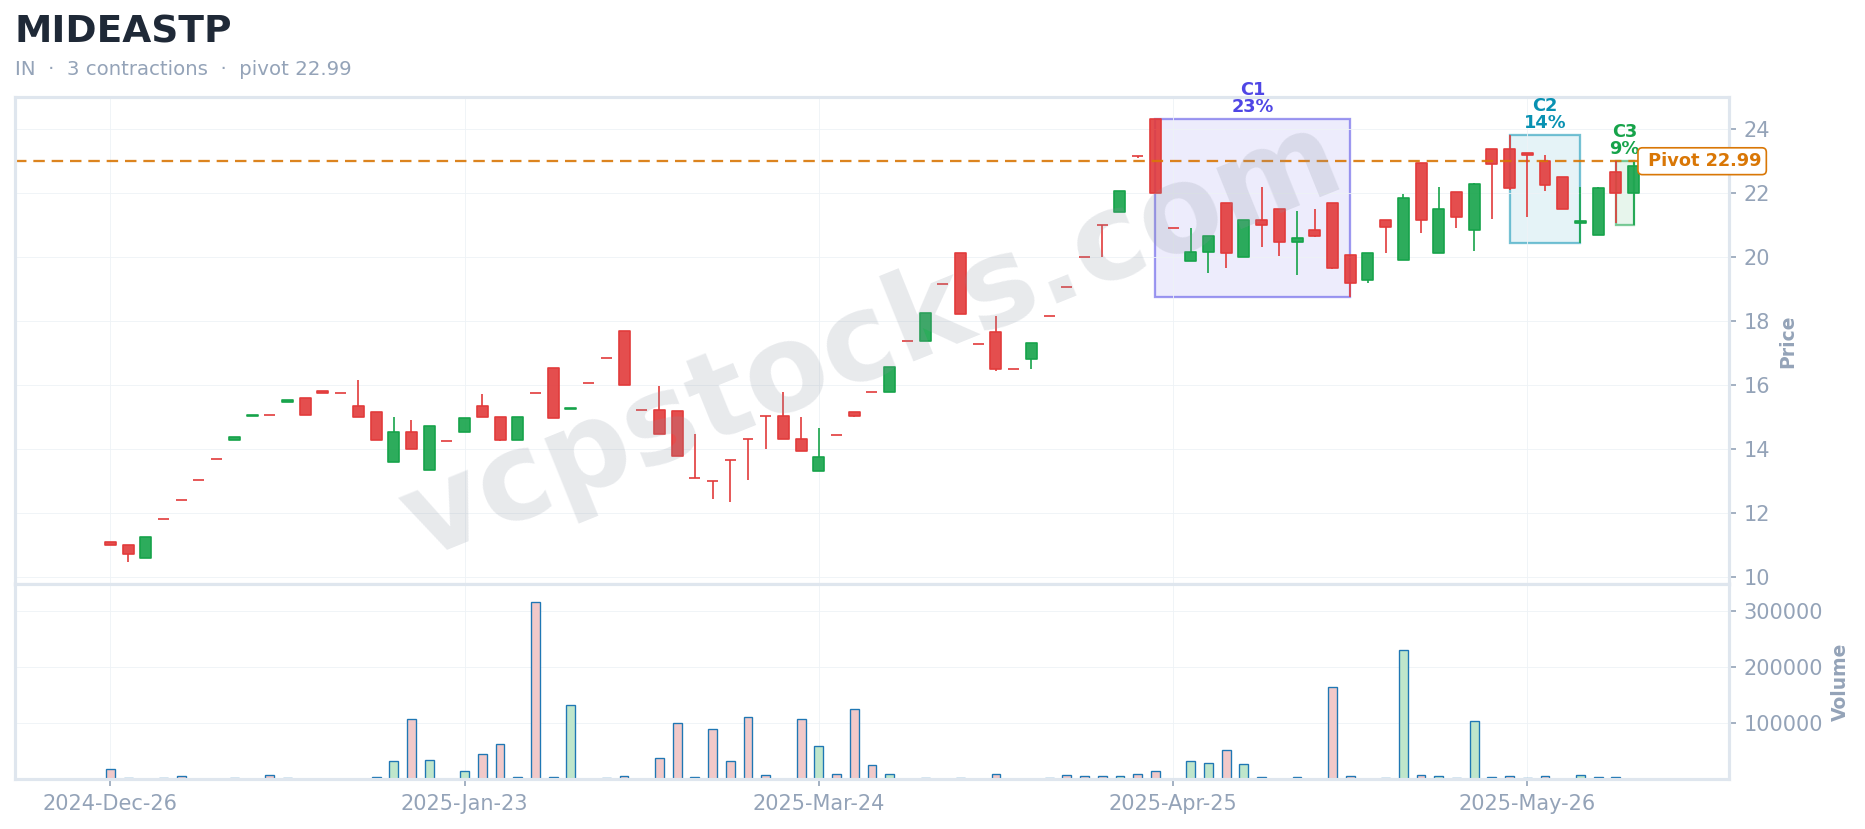
Our algorithm scans every active India stock daily, looking for tight VCP setups with decreasing volume contractions.

2

Detection Chart is Saved

At the exact moment the pattern is flagged, we capture the chart. Nothing is redrawn later. This is the evidence you see below.

3

Outcome is Measured

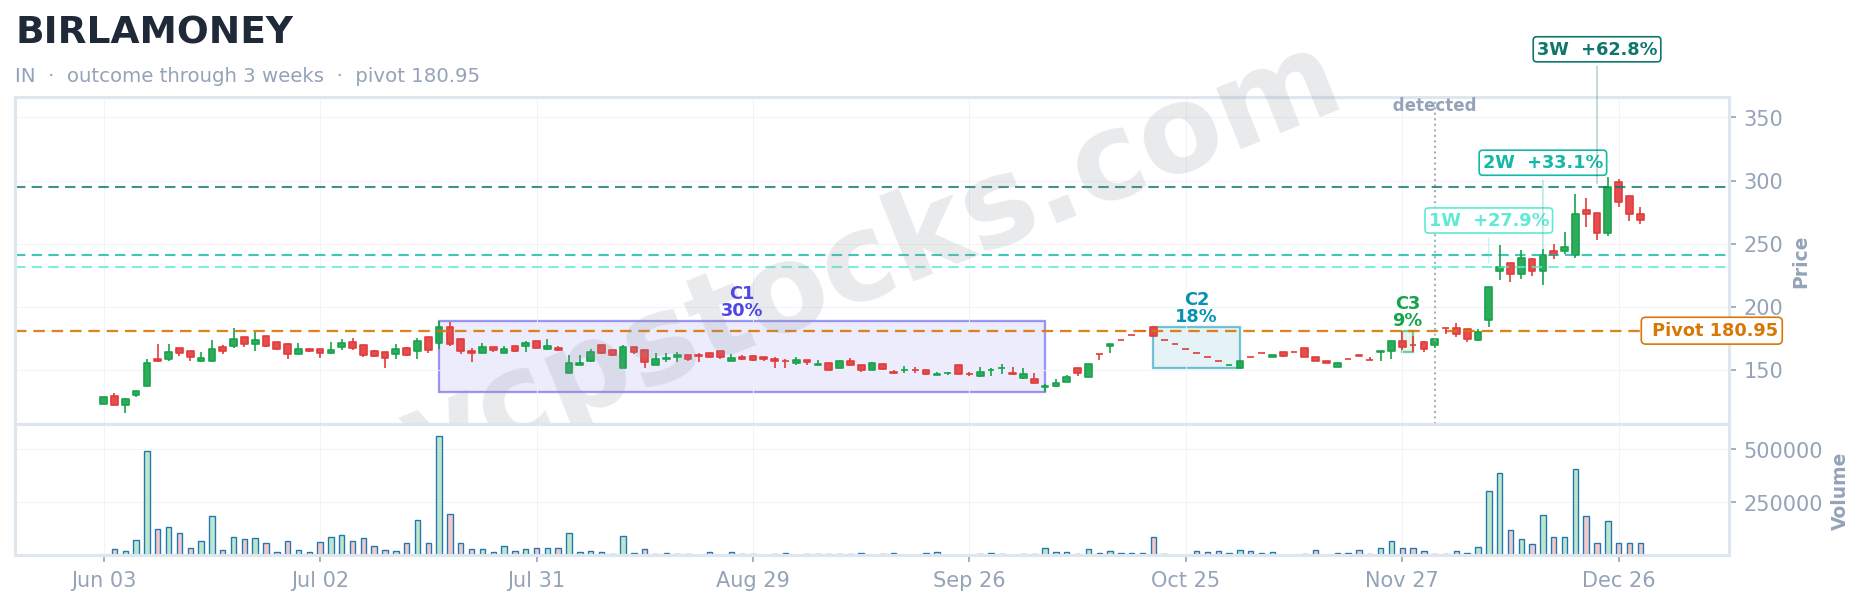
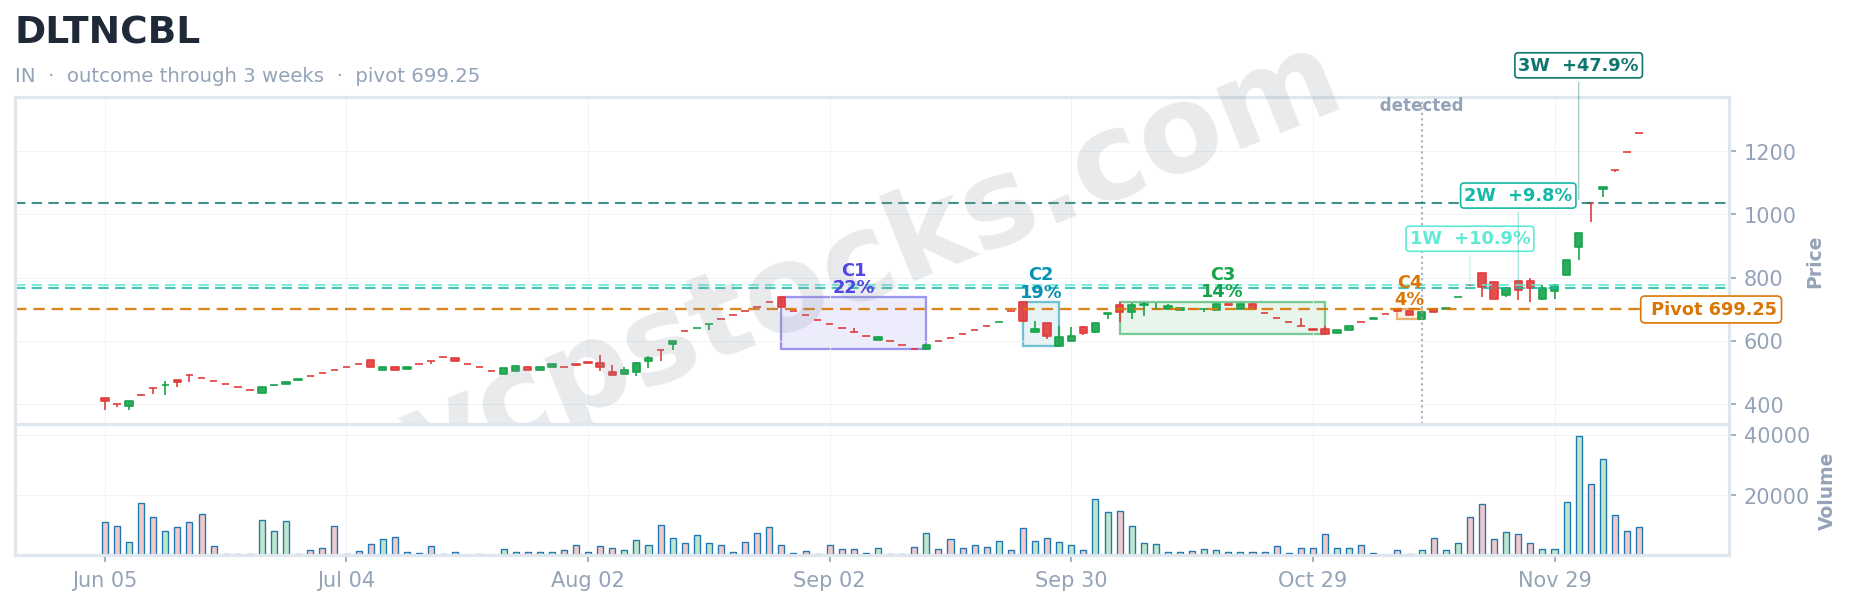
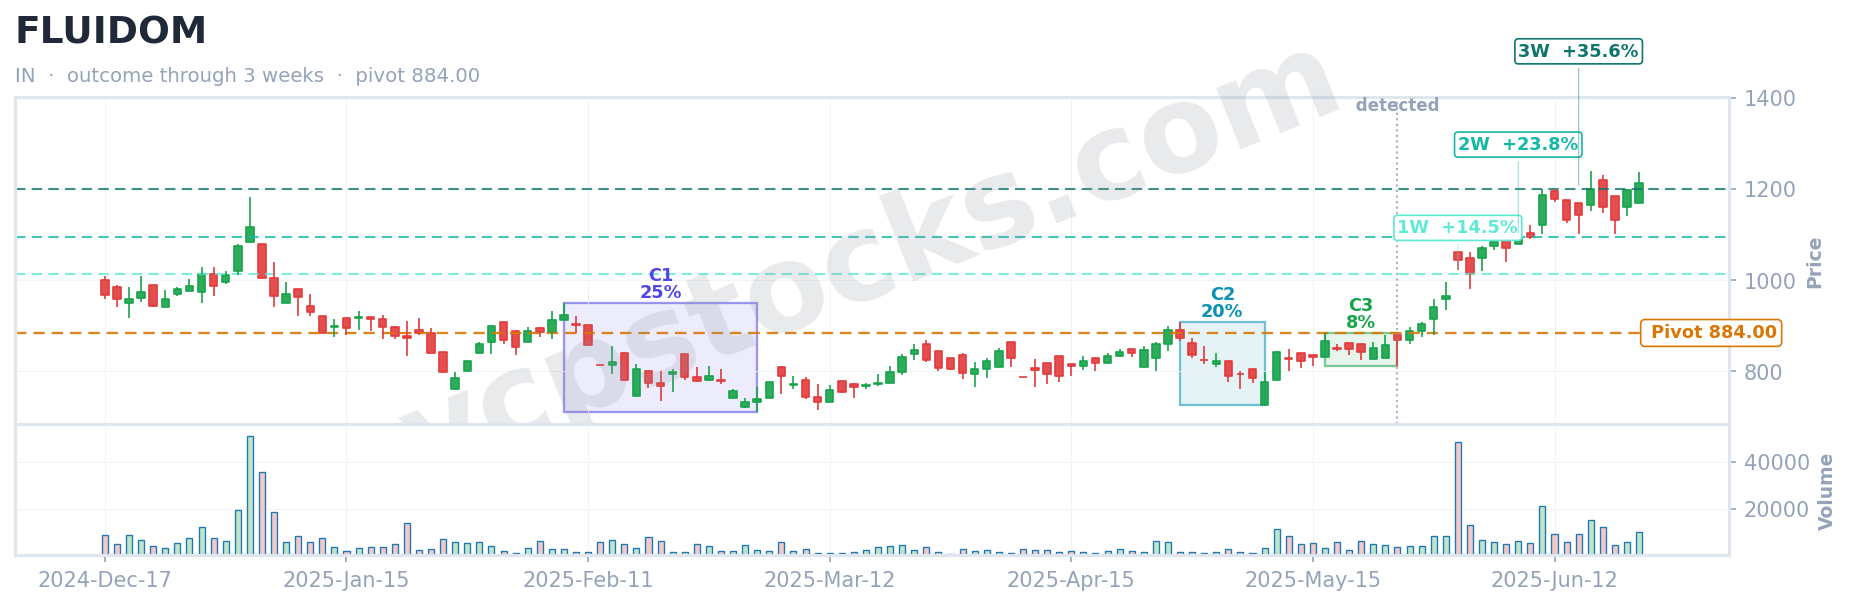
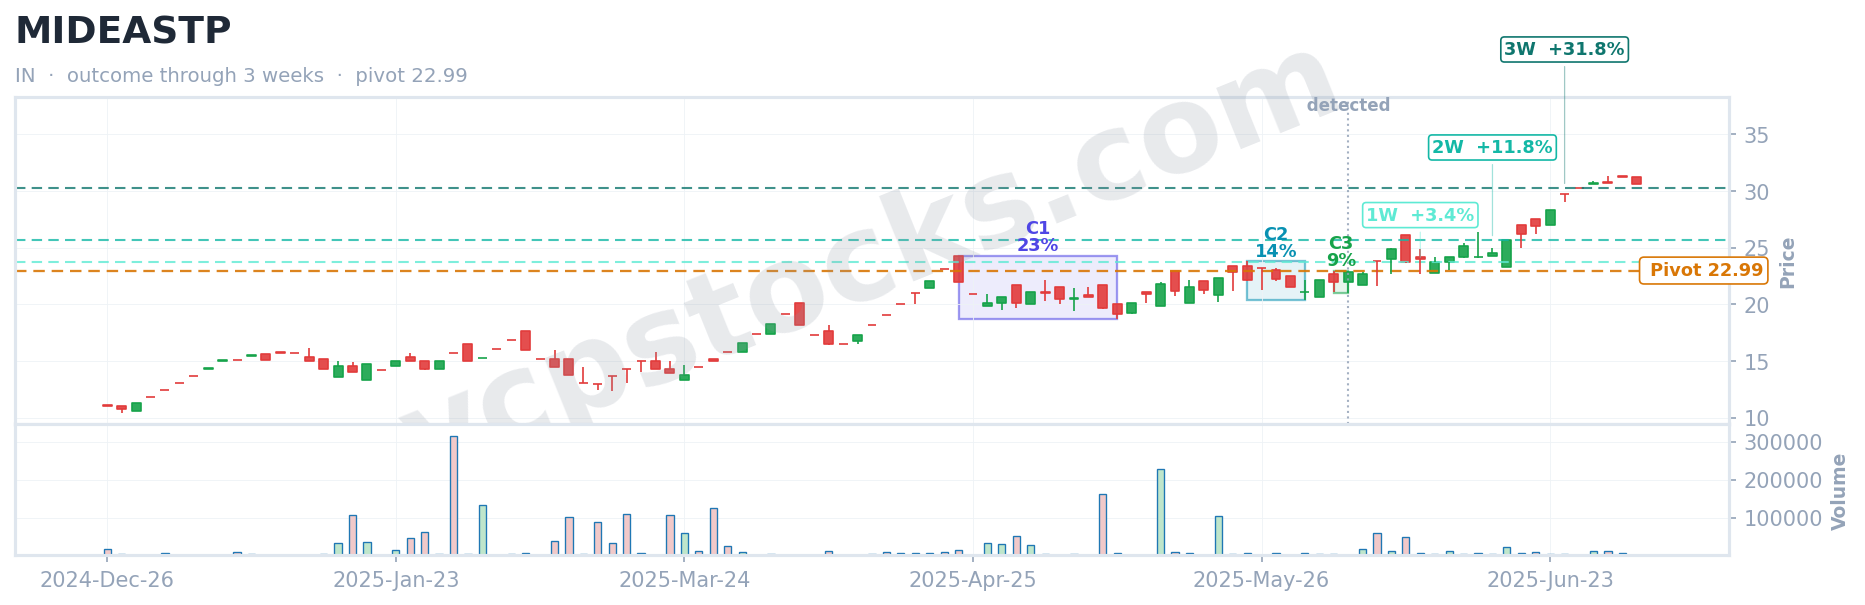
We track price movement over 1, 2, and 3 weeks following detection. The profit or loss is recorded objectively.

4

Only Verified Picks Shown

The picks here all had positive outcomes. We show real numbers so you can judge the system for yourself.

THE PICKS

Detection Chart → Proven Outcome

Each card shows the VCP setup exactly as our screener detected it, paired with the measurable profit outcome that followed.
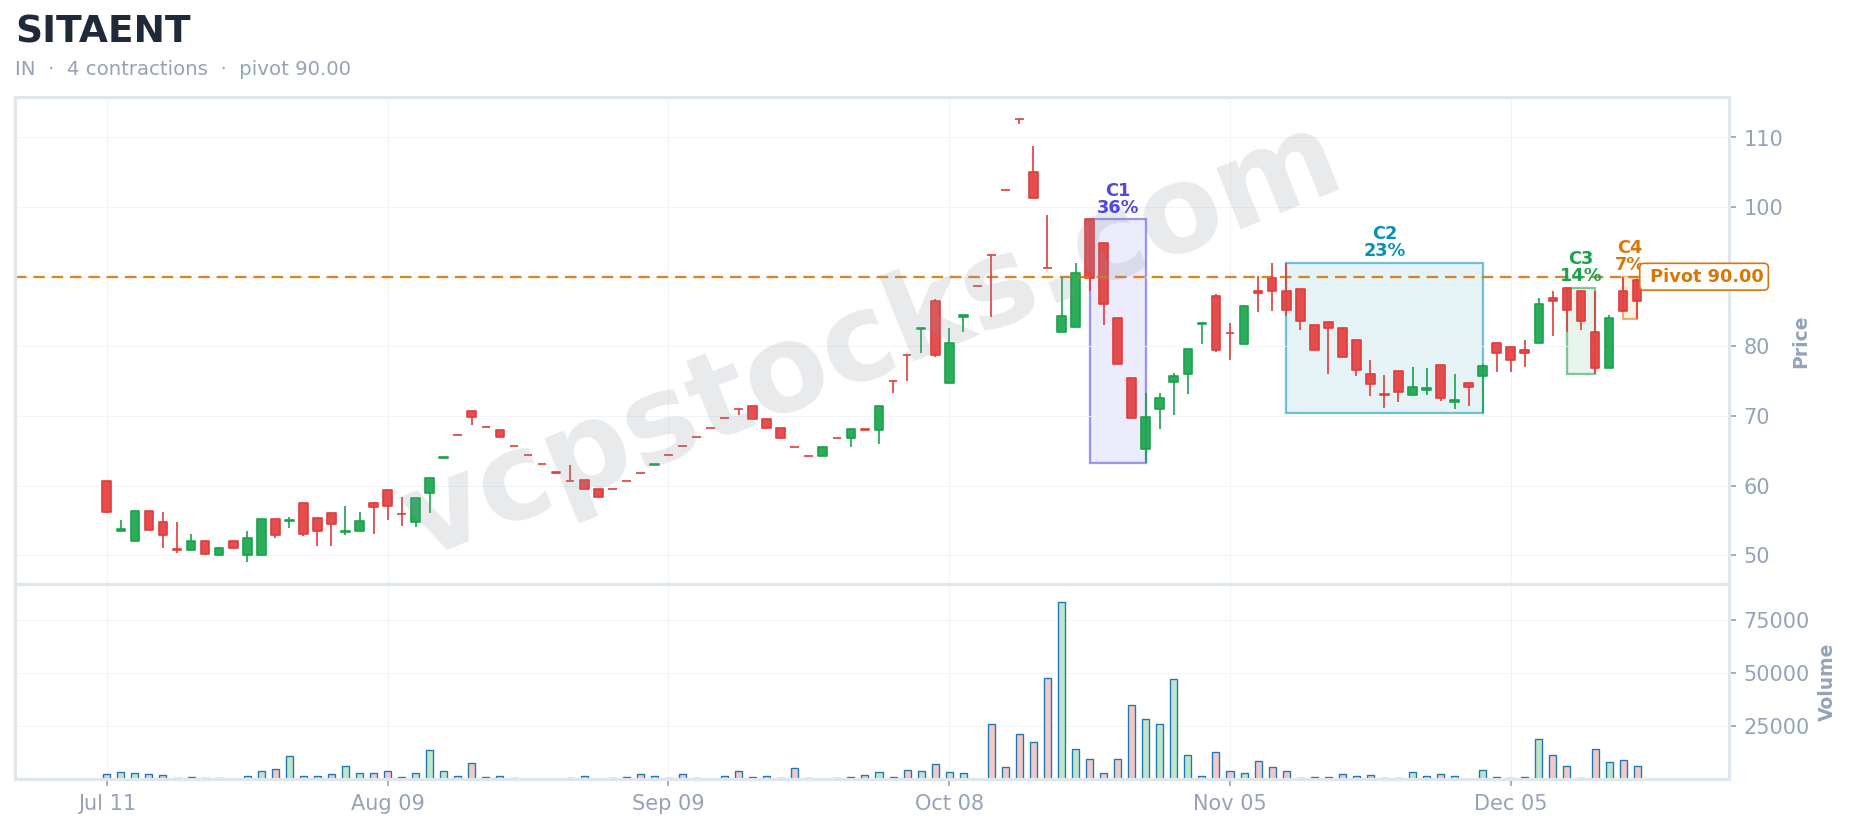
SITAENT
BSE  ·  Detected Dec 18, 2024
VCP Score 30.1 4 contractions IN
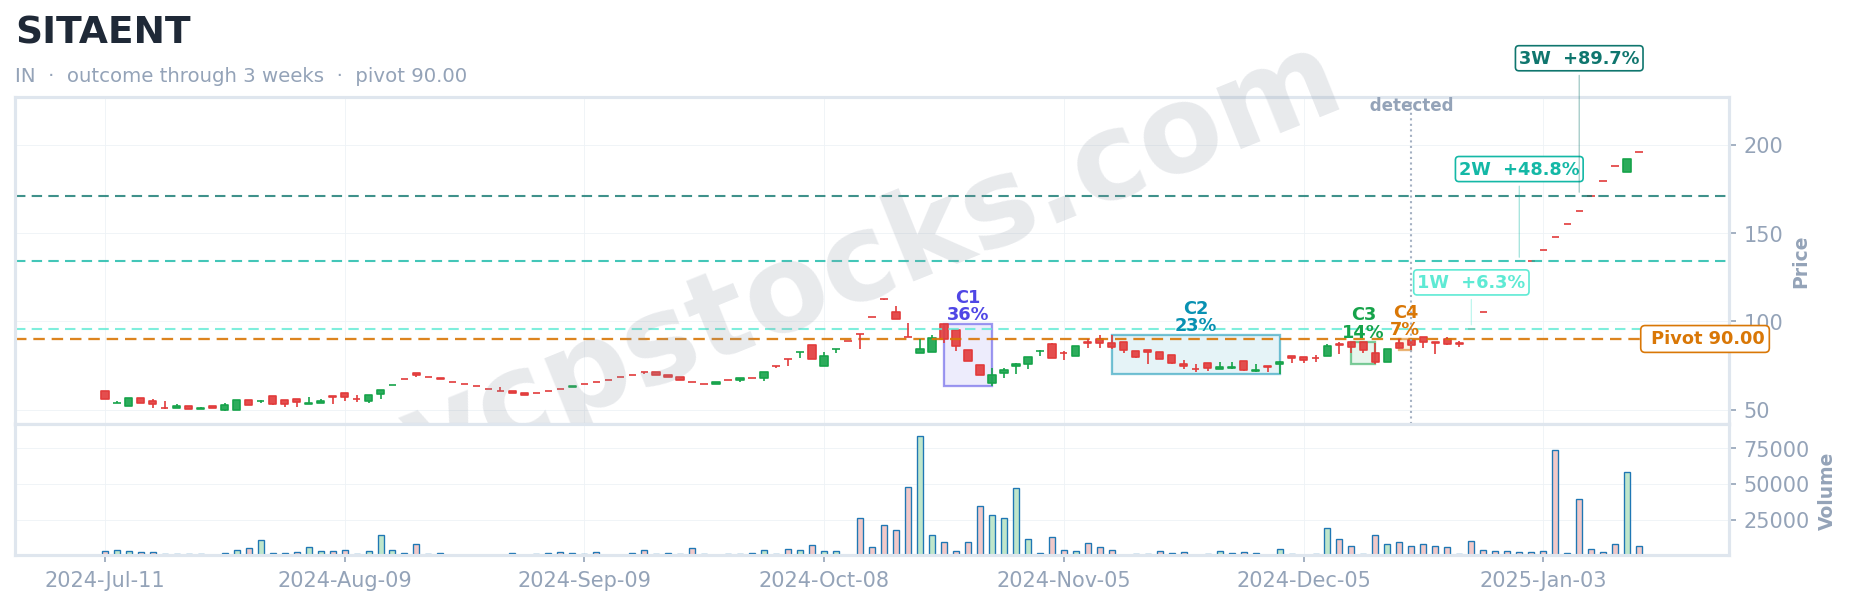
+89.7%
3w proven profit
VCP Setup at Detection
VCP setup for $SITAENT detected Dec 18, 2024
Annotated Outcome Snapshot
VCP outcome for $SITAENT
1 Week
+6.3%
2 Weeks
+48.8%
3 Weeks
+89.7%
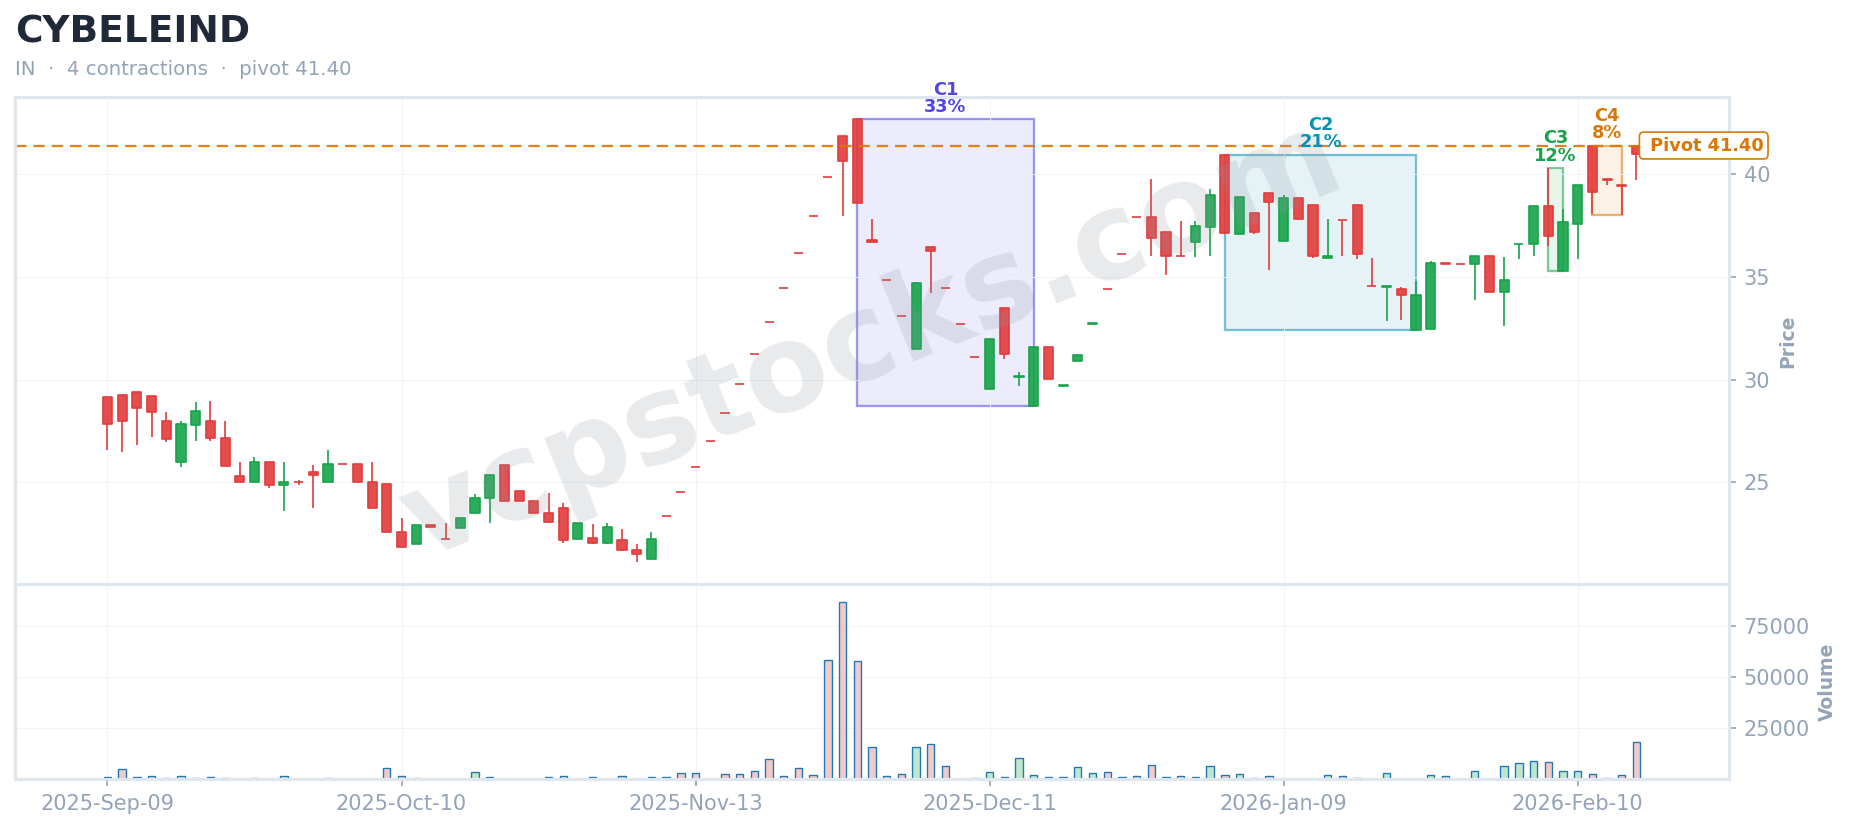
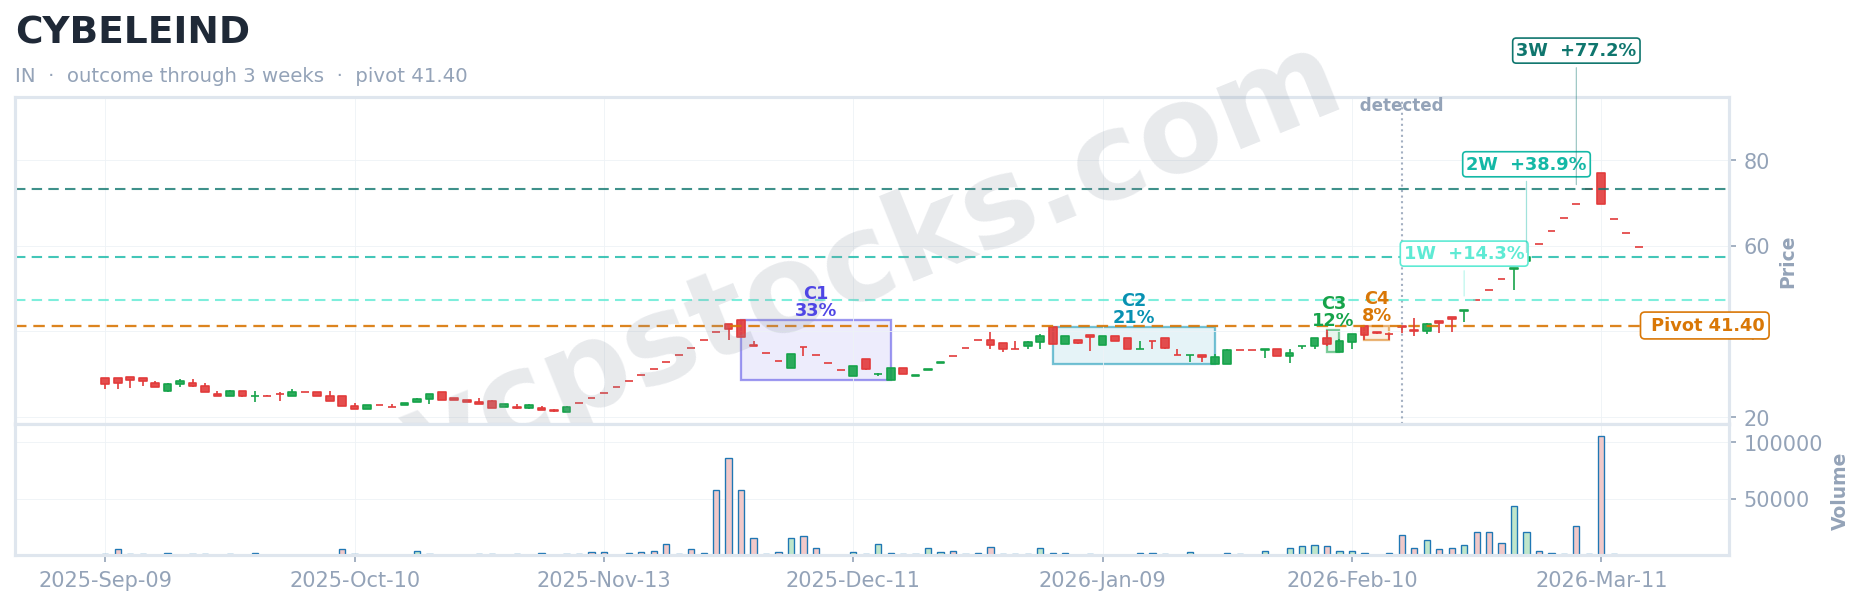
CYBELEIND
BSE  ·  Detected Feb 16, 2026
VCP Score 40.7 4 contractions IN
+77.2%
3w proven profit
VCP Setup at Detection
VCP setup for $CYBELEIND detected Feb 16, 2026
Annotated Outcome Snapshot
VCP outcome for $CYBELEIND
1 Week
+14.3%
2 Weeks
+38.9%
3 Weeks
+77.2%
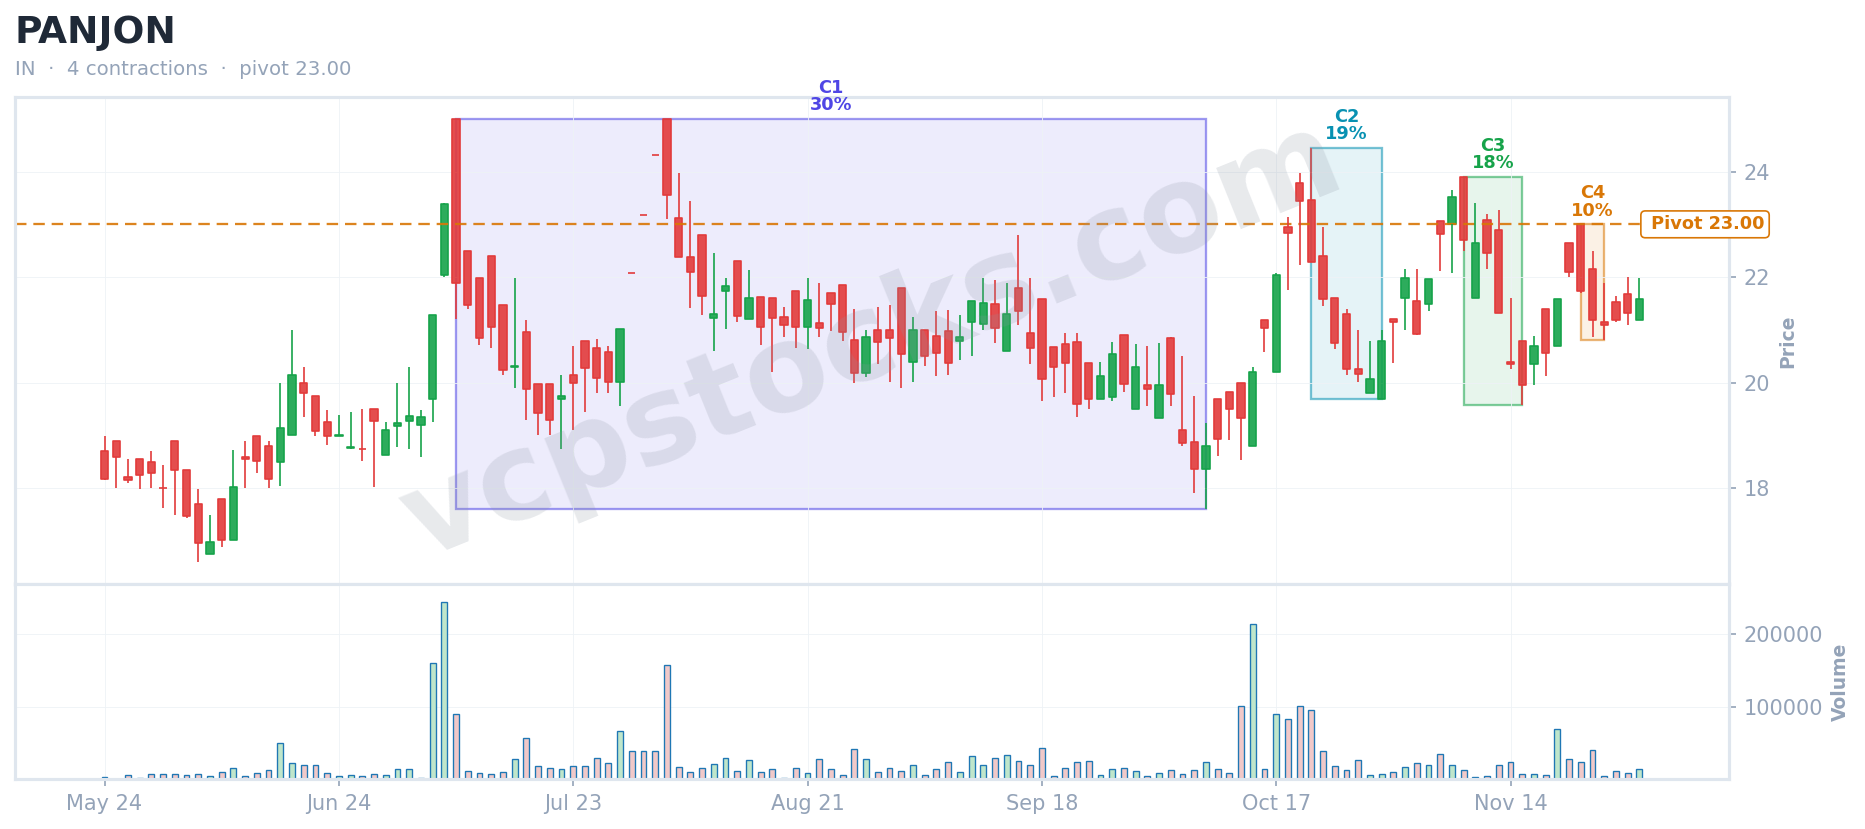
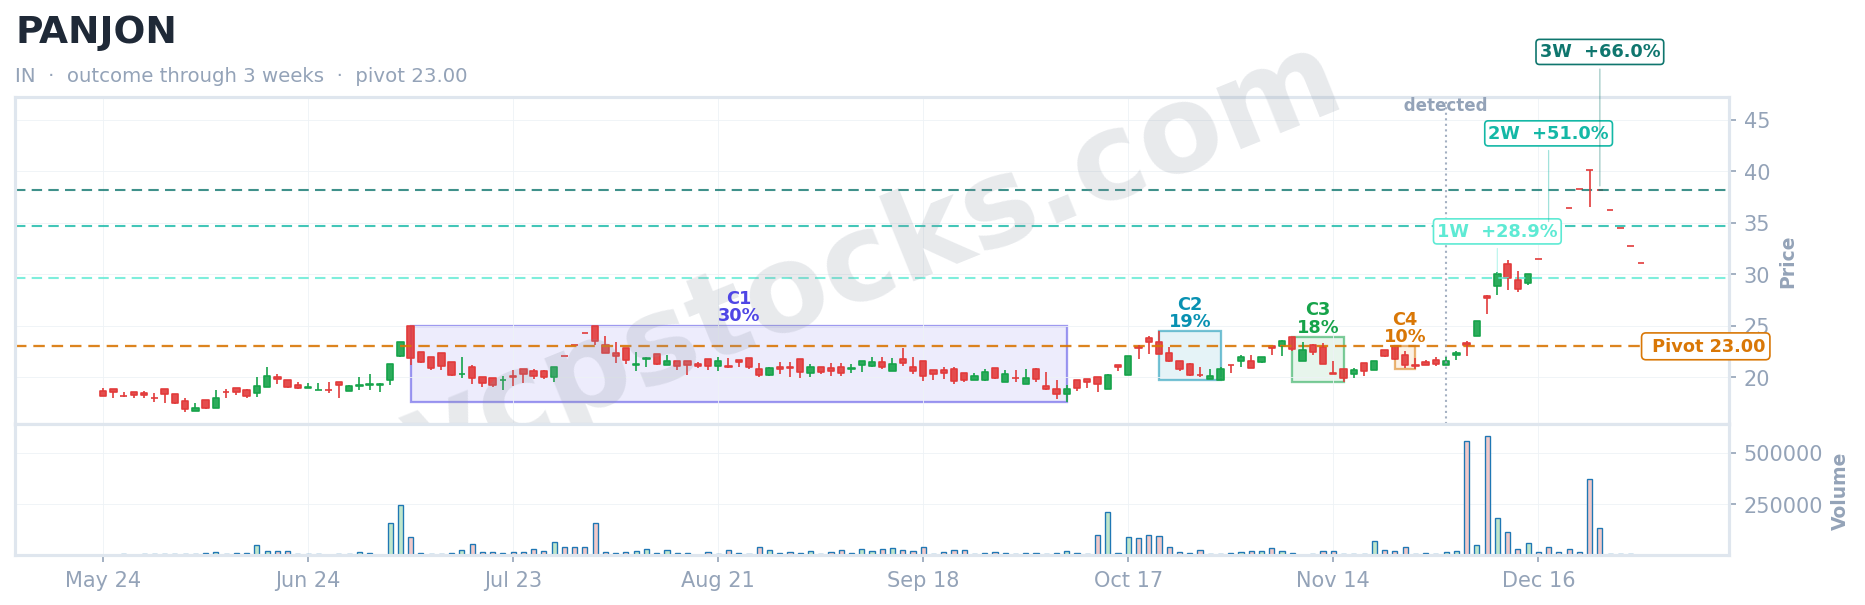
PANJON
BSE  ·  Detected Dec 3, 2024
VCP Score 31.1 4 contractions IN
+51.0%
2w proven profit
VCP Setup at Detection
VCP setup for $PANJON detected Dec 3, 2024
Annotated Outcome Snapshot
VCP outcome for $PANJON
1 Week
+28.9%
2 Weeks
+51.0%
3 Weeks
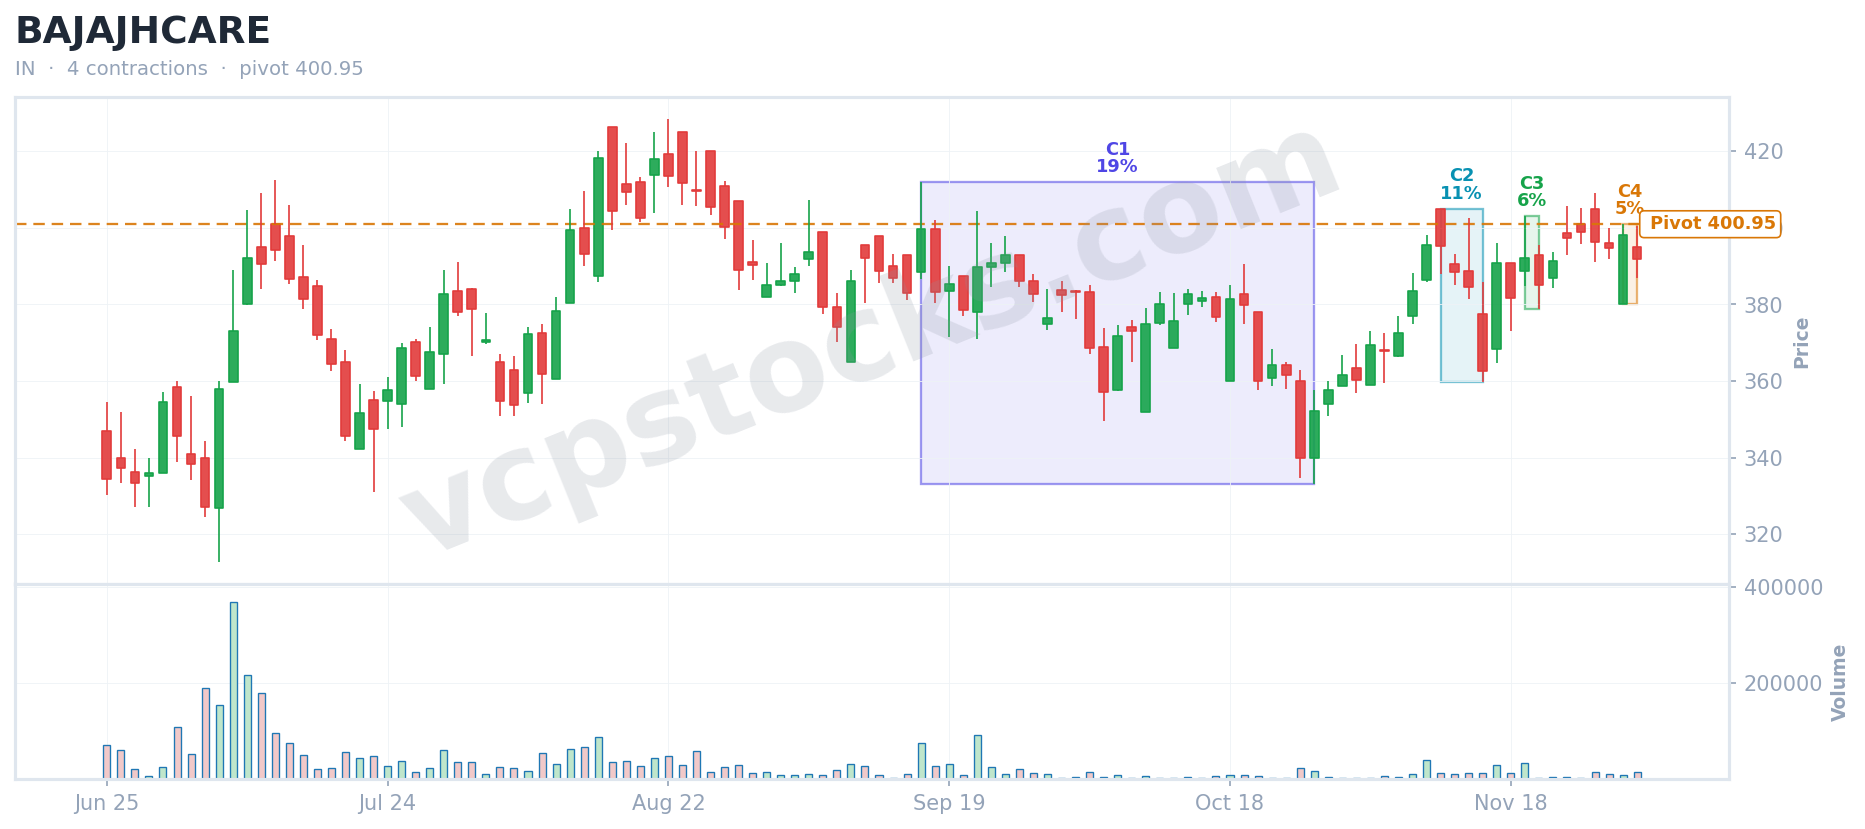
BAJAJHCARE
BSE  ·  Detected Dec 2, 2024
VCP Score 42.7 4 contractions IN
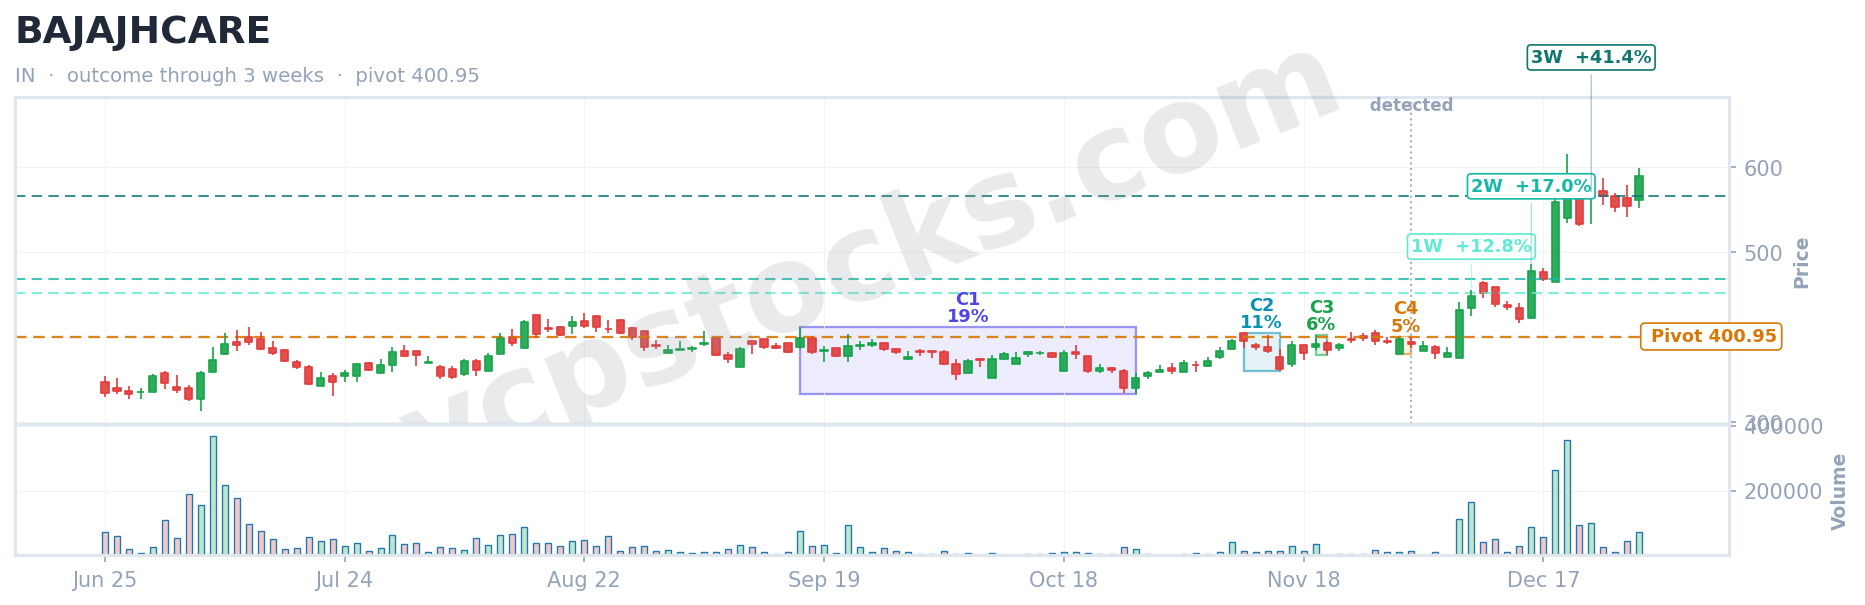
+41.4%
3w proven profit
VCP Setup at Detection
VCP setup for $BAJAJHCARE detected Dec 2, 2024
Annotated Outcome Snapshot
VCP outcome for $BAJAJHCARE
1 Week
+12.8%
2 Weeks
+17.0%
3 Weeks
+41.4%
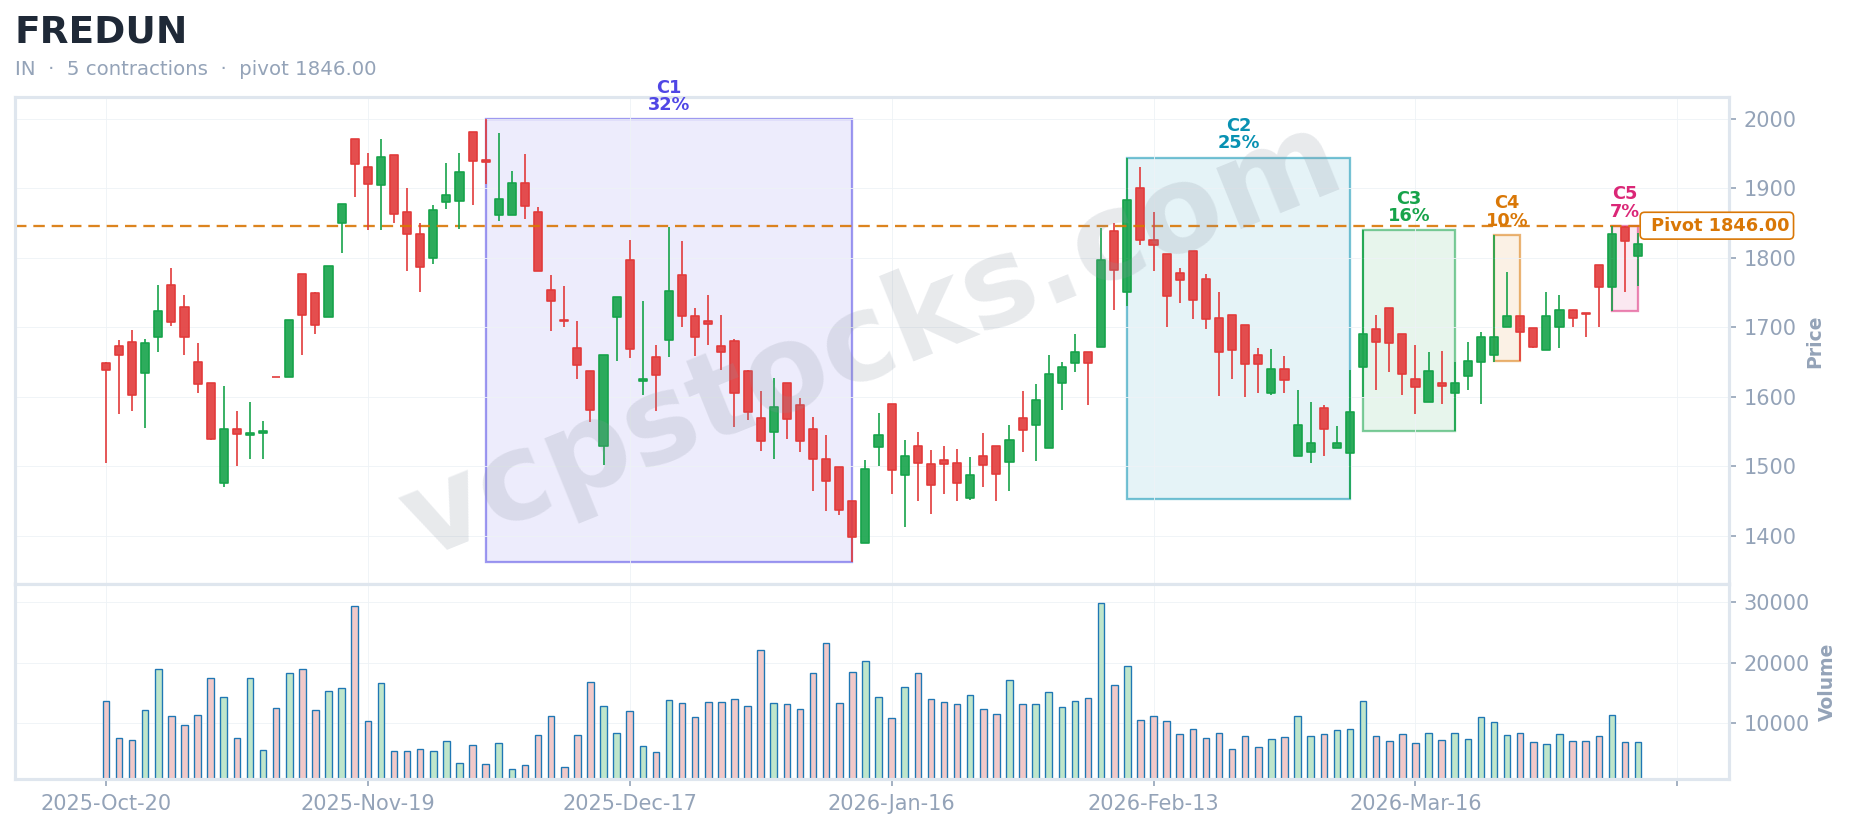
FREDUN
BSE  ·  Detected Apr 13, 2026
VCP Score 55.4 5 contractions IN
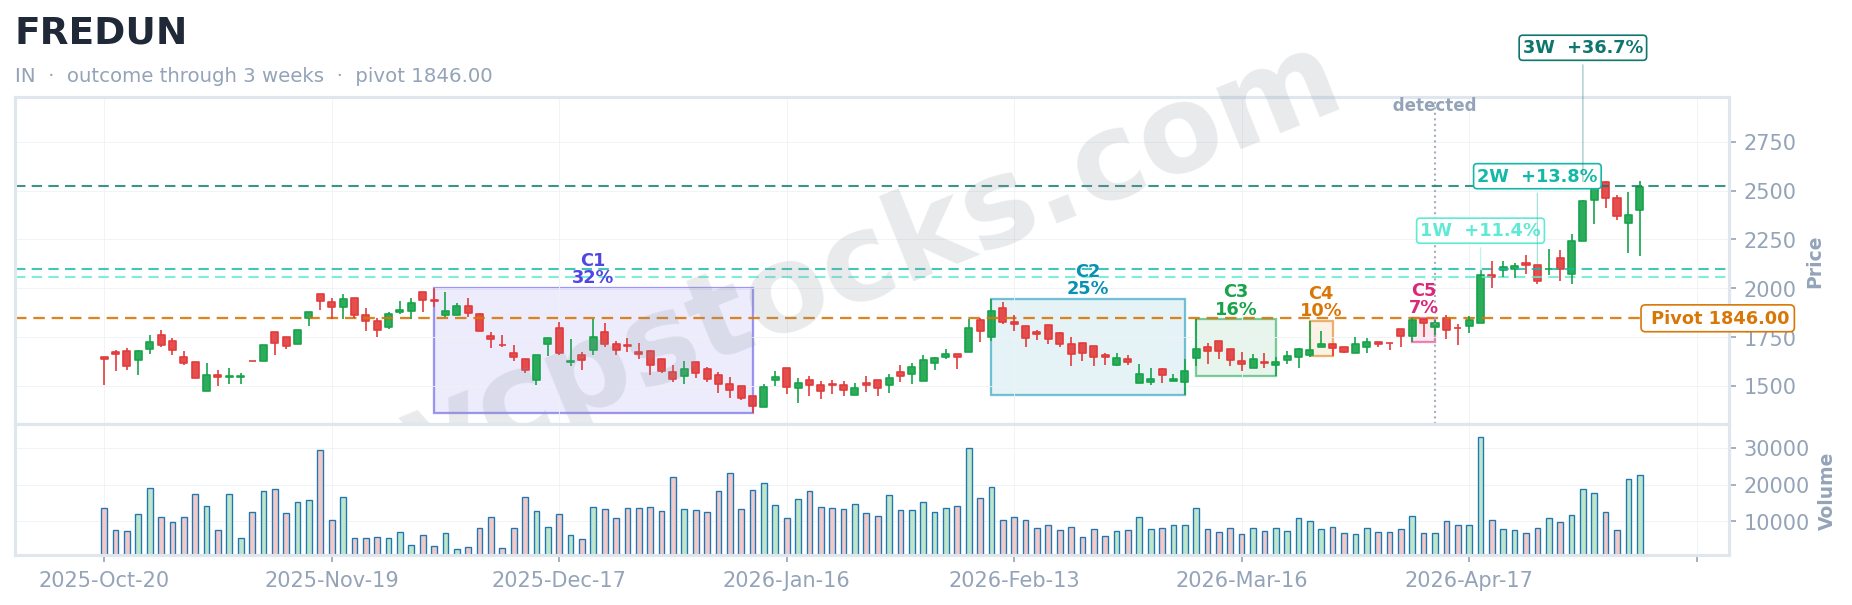
+36.7%
3w proven profit
VCP Setup at Detection
VCP setup for $FREDUN detected Apr 13, 2026
Annotated Outcome Snapshot
VCP outcome for $FREDUN
1 Week
2 Weeks
+13.8%
3 Weeks
+36.7%
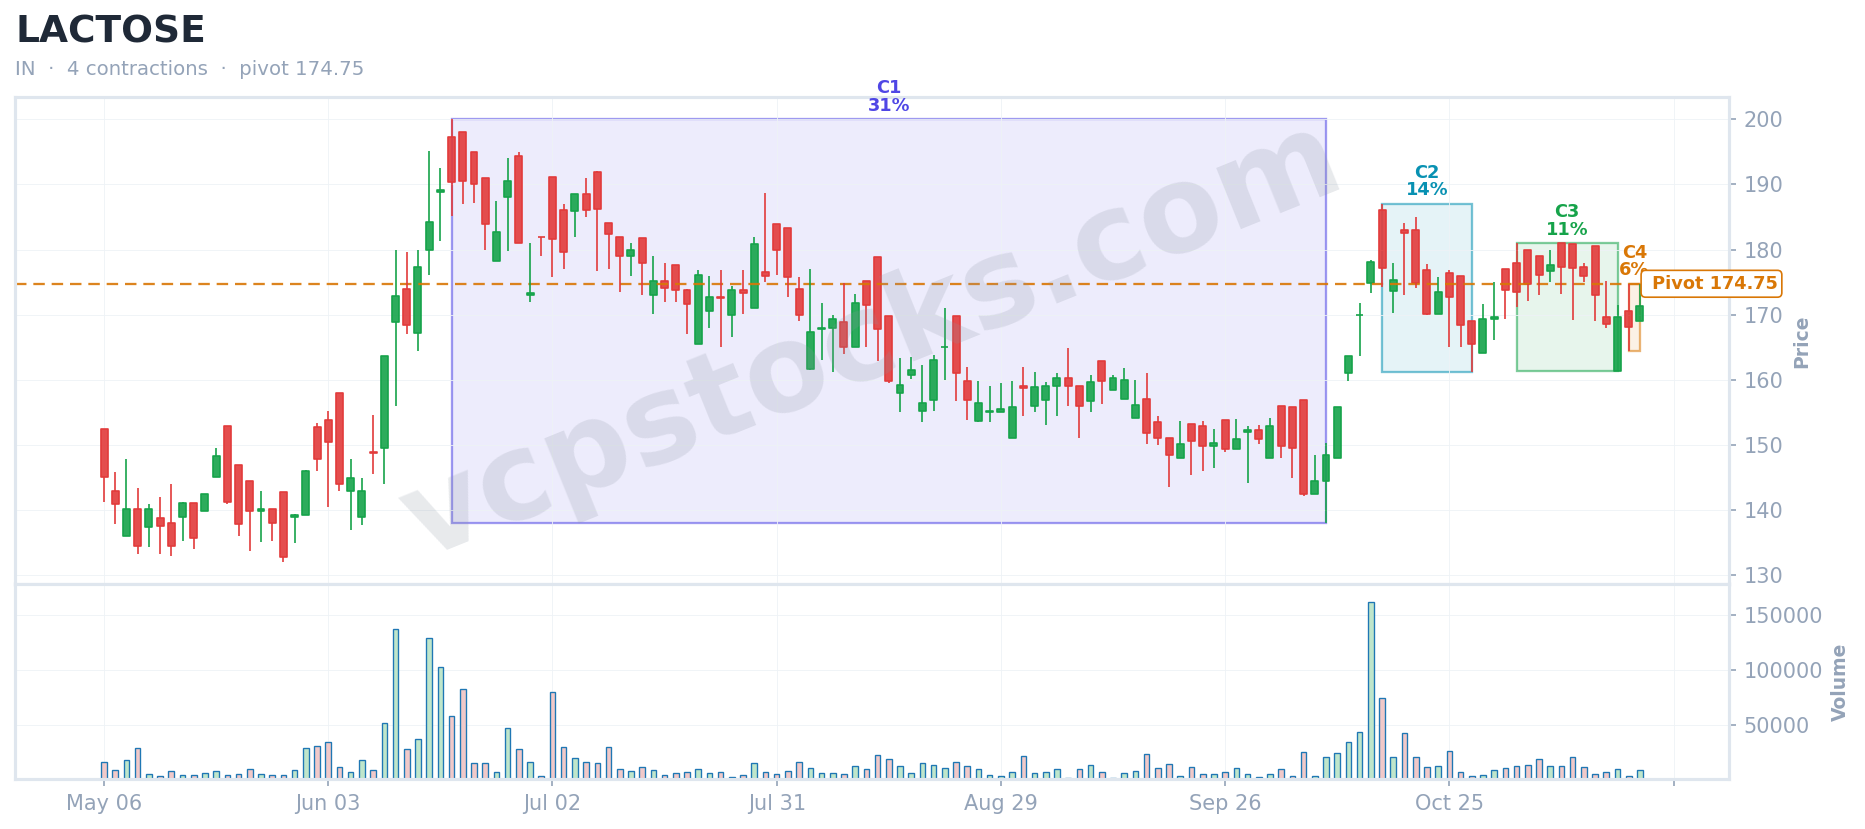
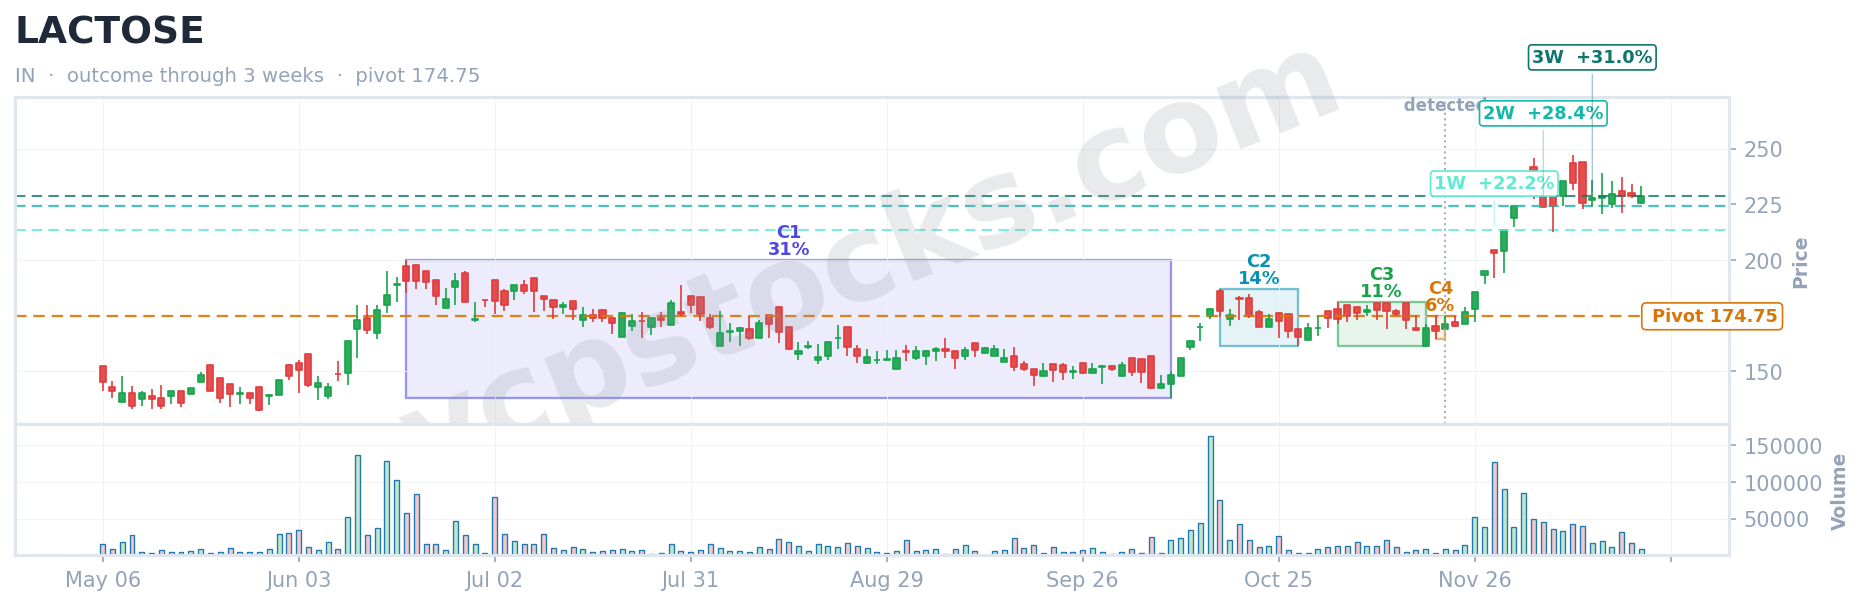
LACTOSE
BSE  ·  Detected Nov 21, 2024
VCP Score 39.6 4 contractions IN
+31.0%
3w proven profit
VCP Setup at Detection
VCP setup for $LACTOSE detected Nov 21, 2024
1 Week
+22.2%
2 Weeks
+28.4%
3 Weeks
+31.0%
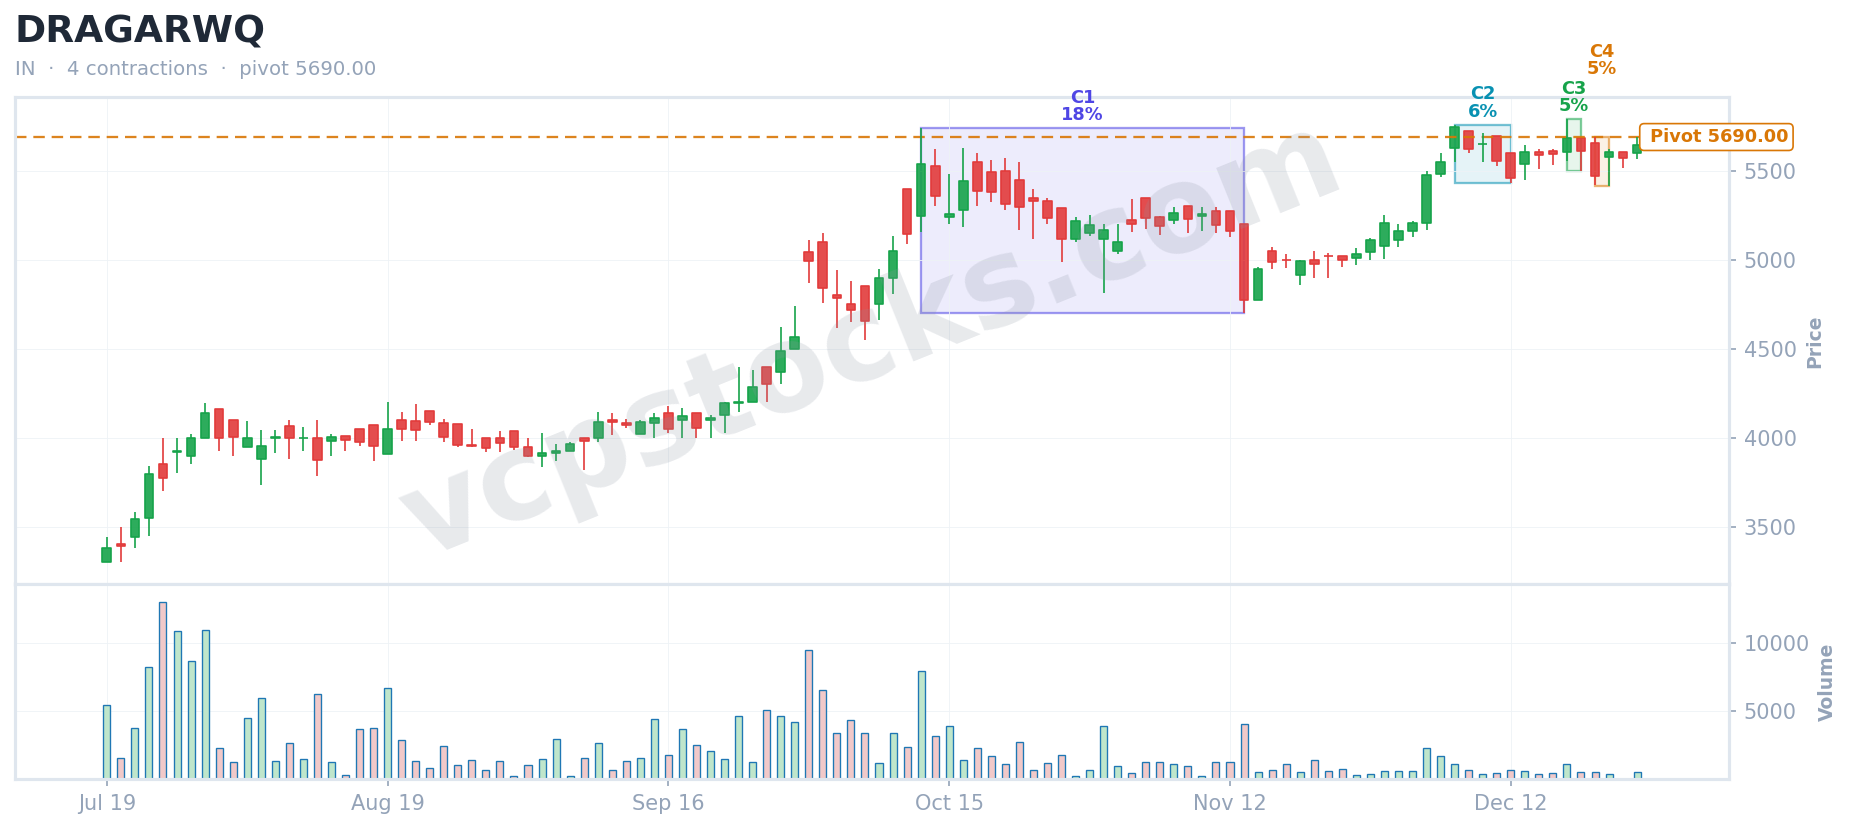
DRAGARWQ
BSE  ·  Detected Dec 26, 2024
VCP Score 50.3 4 contractions IN
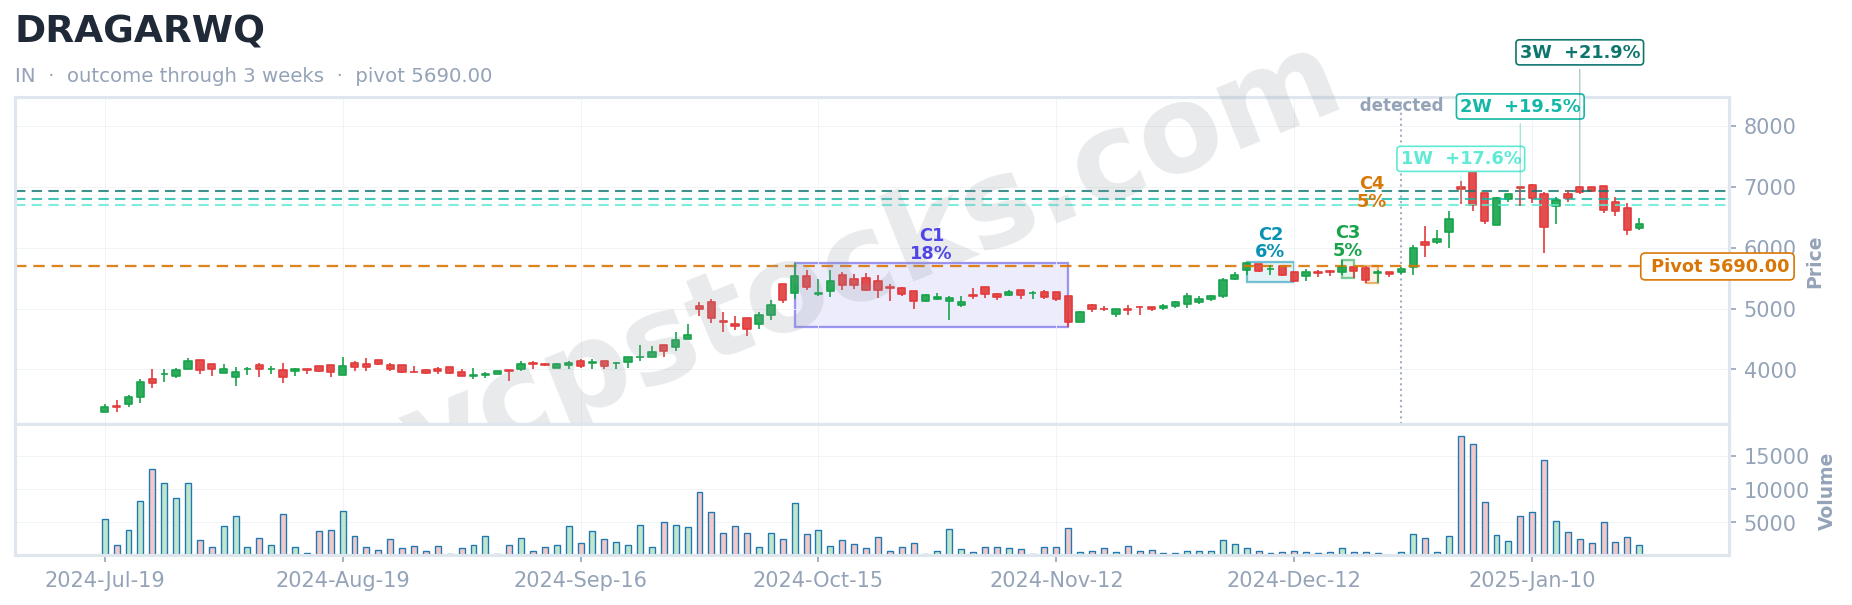
+21.9%
3w proven profit
VCP Setup at Detection
VCP setup for $DRAGARWQ detected Dec 26, 2024
Annotated Outcome Snapshot
VCP outcome for $DRAGARWQ
1 Week
+17.6%
2 Weeks
+19.5%
3 Weeks
+21.9%
ITDCEM
BSE  ·  Detected May 19, 2025
VCP Score 58.4 2 contractions IN
+18.0%
3w proven profit
VCP Setup at Detection
VCP setup for $ITDCEM detected May 19, 2025
Annotated Outcome Snapshot
VCP outcome for $ITDCEM
1 Week
+6.2%
2 Weeks
+8.0%
3 Weeks
+18.0%
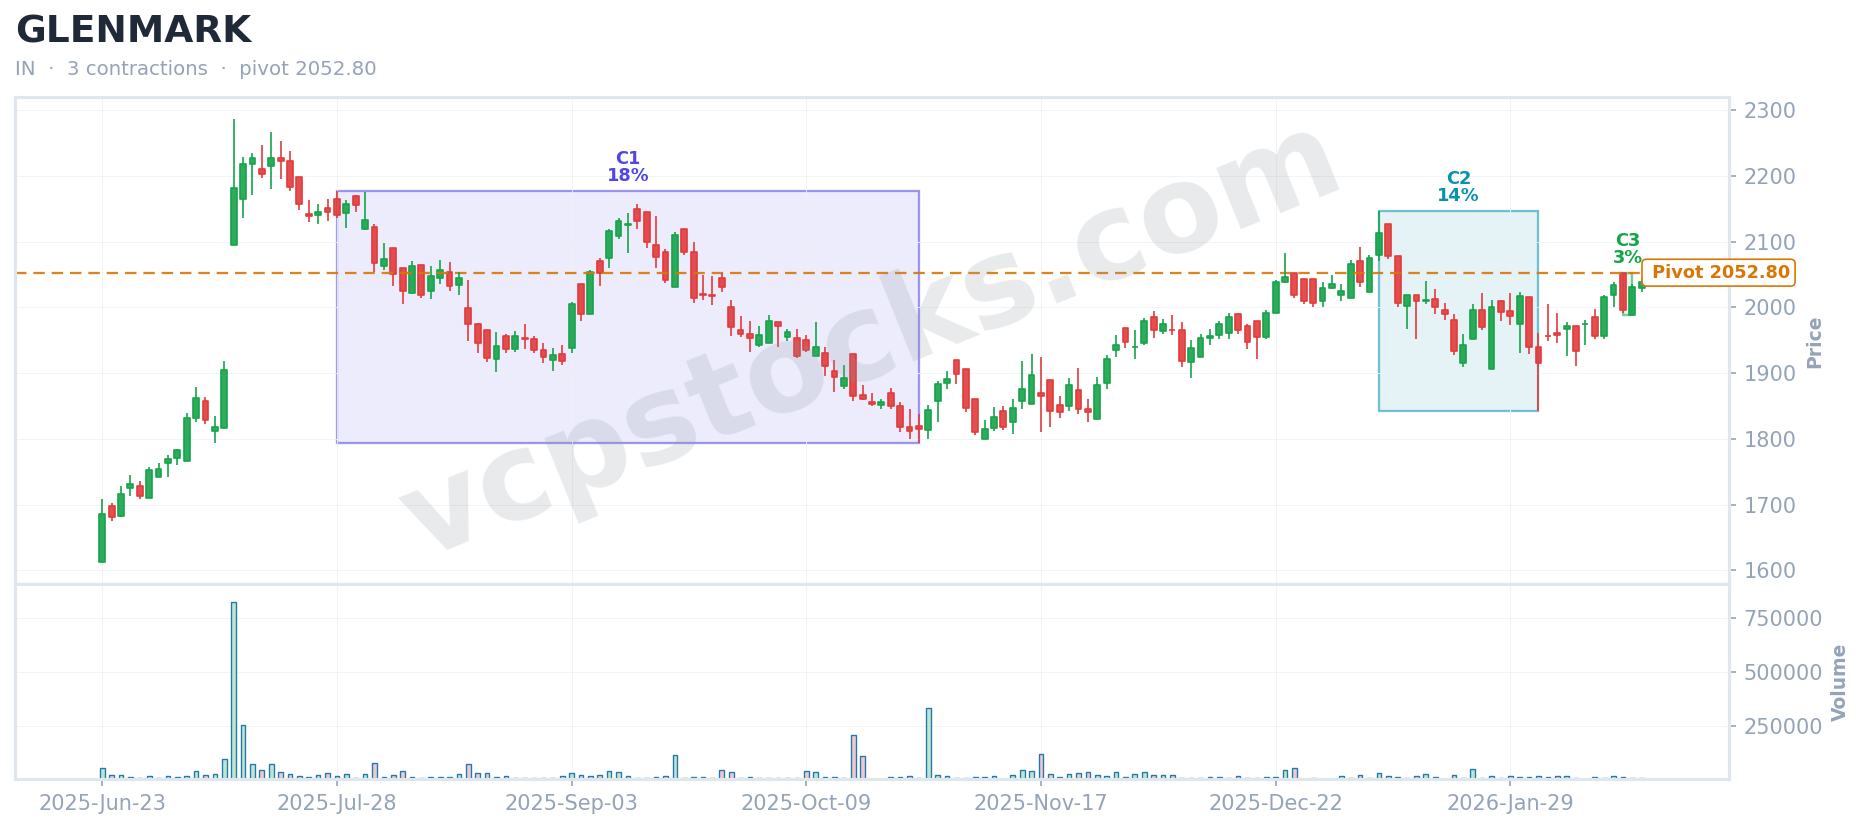
GLENMARK
BSE  ·  Detected Feb 17, 2026
VCP Score 51.8 3 contractions IN
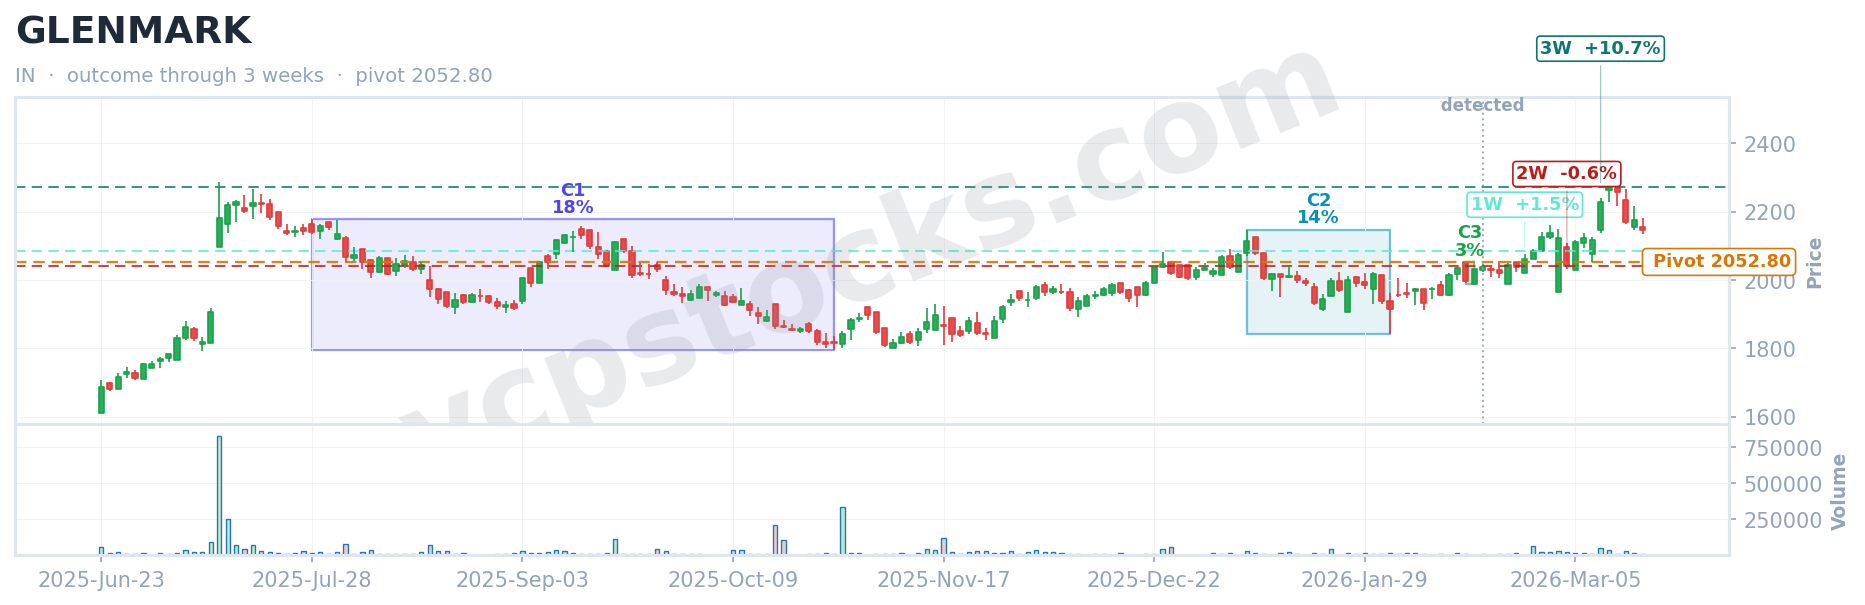
+10.7%
3w proven profit
VCP Setup at Detection
VCP setup for $GLENMARK detected Feb 17, 2026
Annotated Outcome Snapshot
VCP outcome for $GLENMARK
1 Week
+1.5%
2 Weeks
-0.6%
3 Weeks
+10.7%
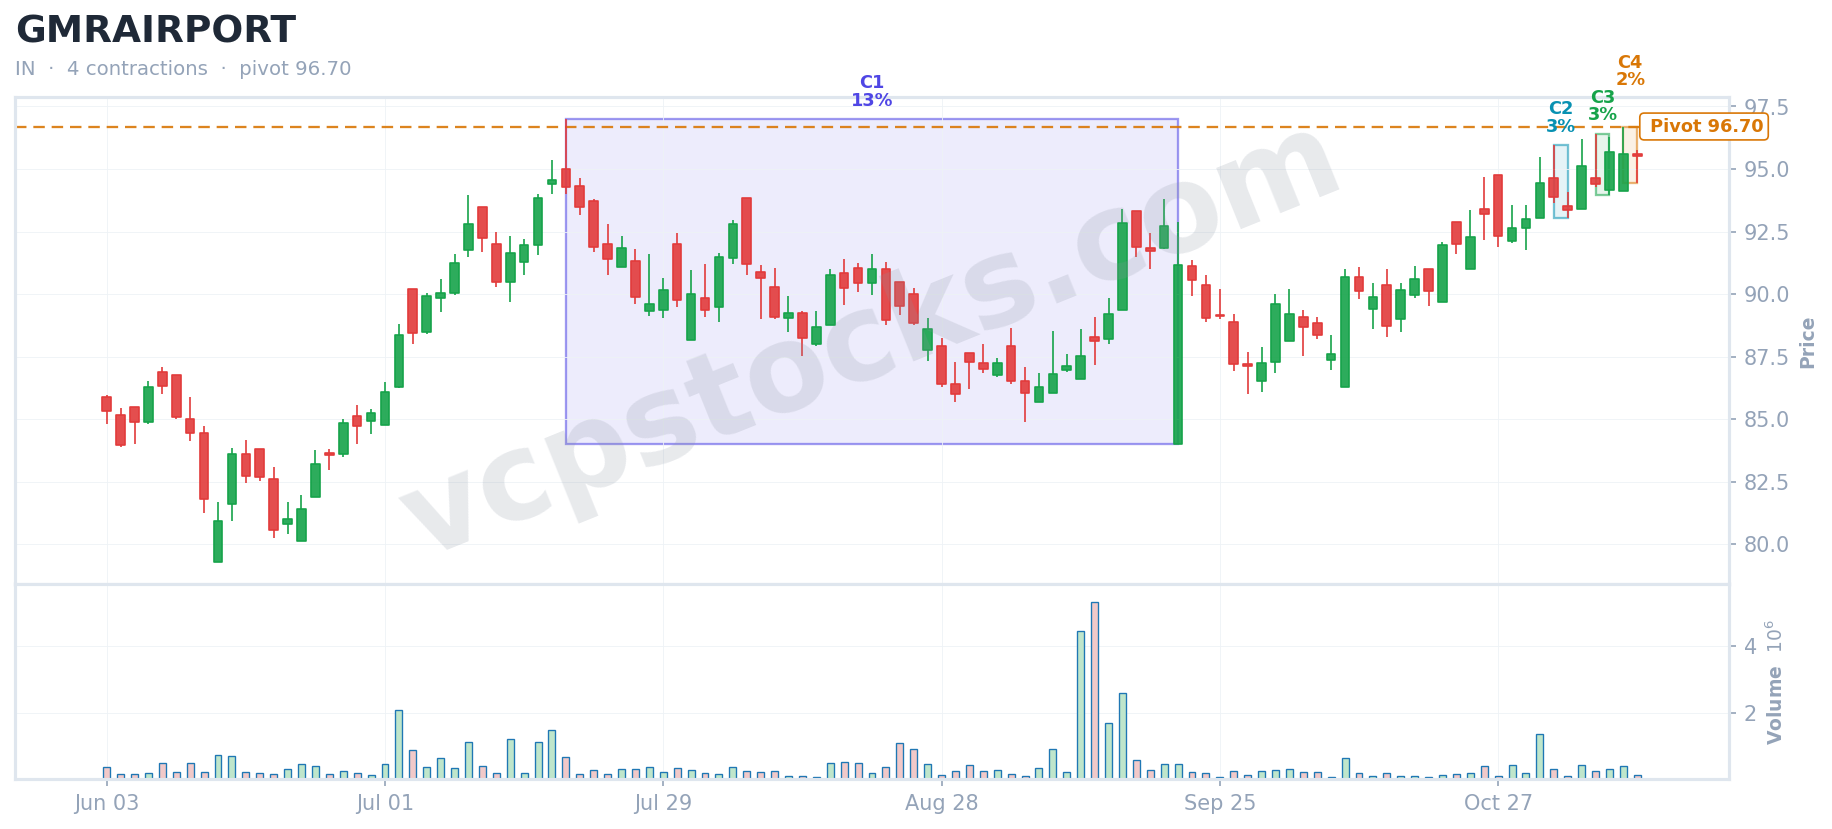
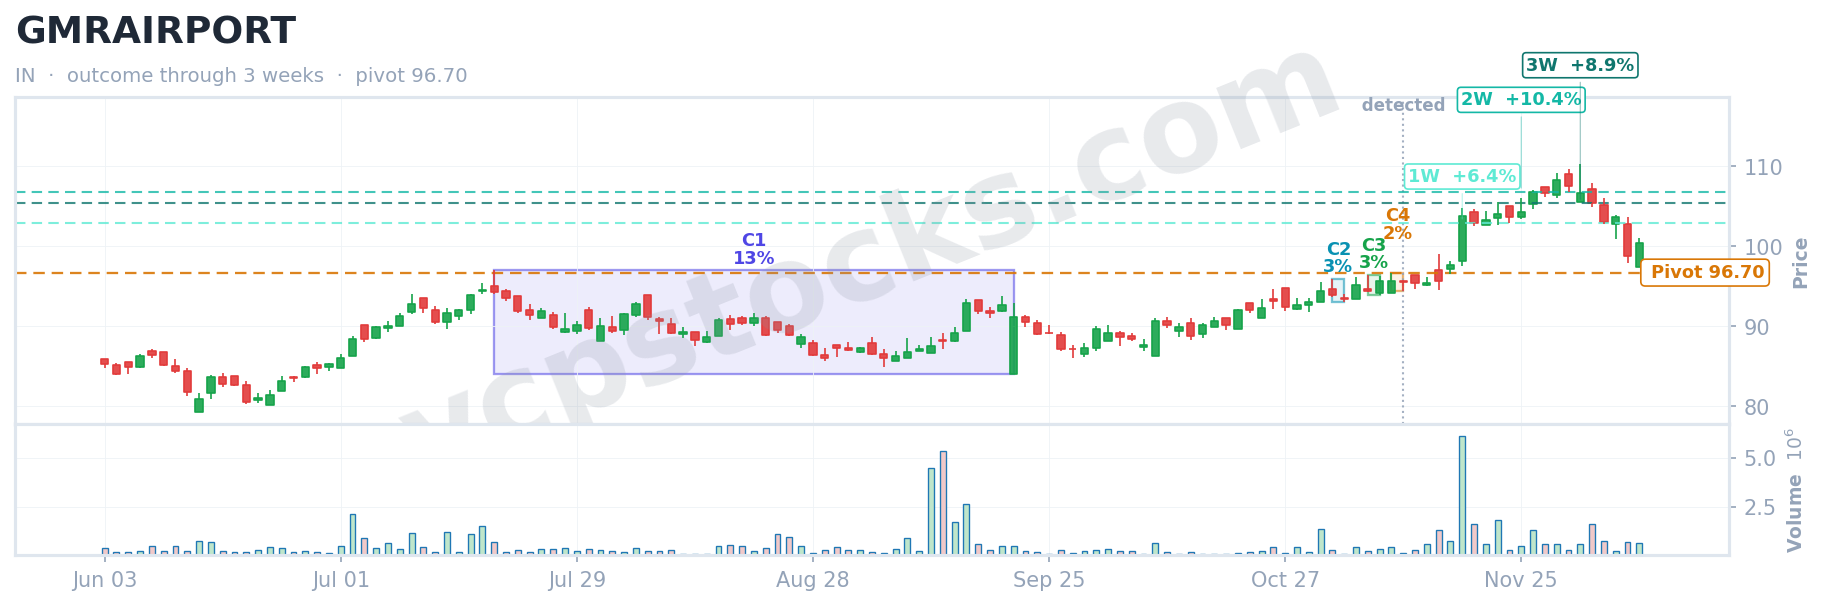
GMRAIRPORT
BSE  ·  Detected Nov 11, 2025
VCP Score 58.9 4 contractions IN
+9.0%
3w proven profit
VCP Setup at Detection
VCP setup for $GMRAIRPORT detected Nov 11, 2025
Annotated Outcome Snapshot
VCP outcome for $GMRAIRPORT
1 Week
+6.4%
2 Weeks
+10.4%
3 Weeks
+9.0%
STYRENIX
BSE  ·  Detected May 29, 2025
VCP Score 54.8 2 contractions IN
+8.6%
3w proven profit
VCP Setup at Detection
VCP setup for $STYRENIX detected May 29, 2025
Annotated Outcome Snapshot
VCP outcome for $STYRENIX
1 Week
+7.6%
2 Weeks
+8.1%
3 Weeks
+8.6%

The picks shown are historical examples detected by our screener. Provided for informational and educational purposes only — not financial advice. Past performance does not guarantee future results. All investing involves risk.

Not Every VCP Setup Will Result in a Successful Breakout

A well-formed VCP pattern is a high-probability signal — not a certainty. Even technically sound setups can fail due to broader market conditions, sector rotation, unexpected earnings, or macro events. The picks shown on this page are verified historical examples; they demonstrate what the methodology can identify — they are not a guarantee of future performance. Before entering any trade, you must conduct your own analysis, evaluate the prevailing market environment, determine an appropriate position size, and define your maximum acceptable loss. Independent judgment and disciplined risk management are irreplaceable components of any sound trading strategy.

click anywhere or Esc to close Chart enlarged