Our VCP Picks Don't Lie.
The Charts Say It All.
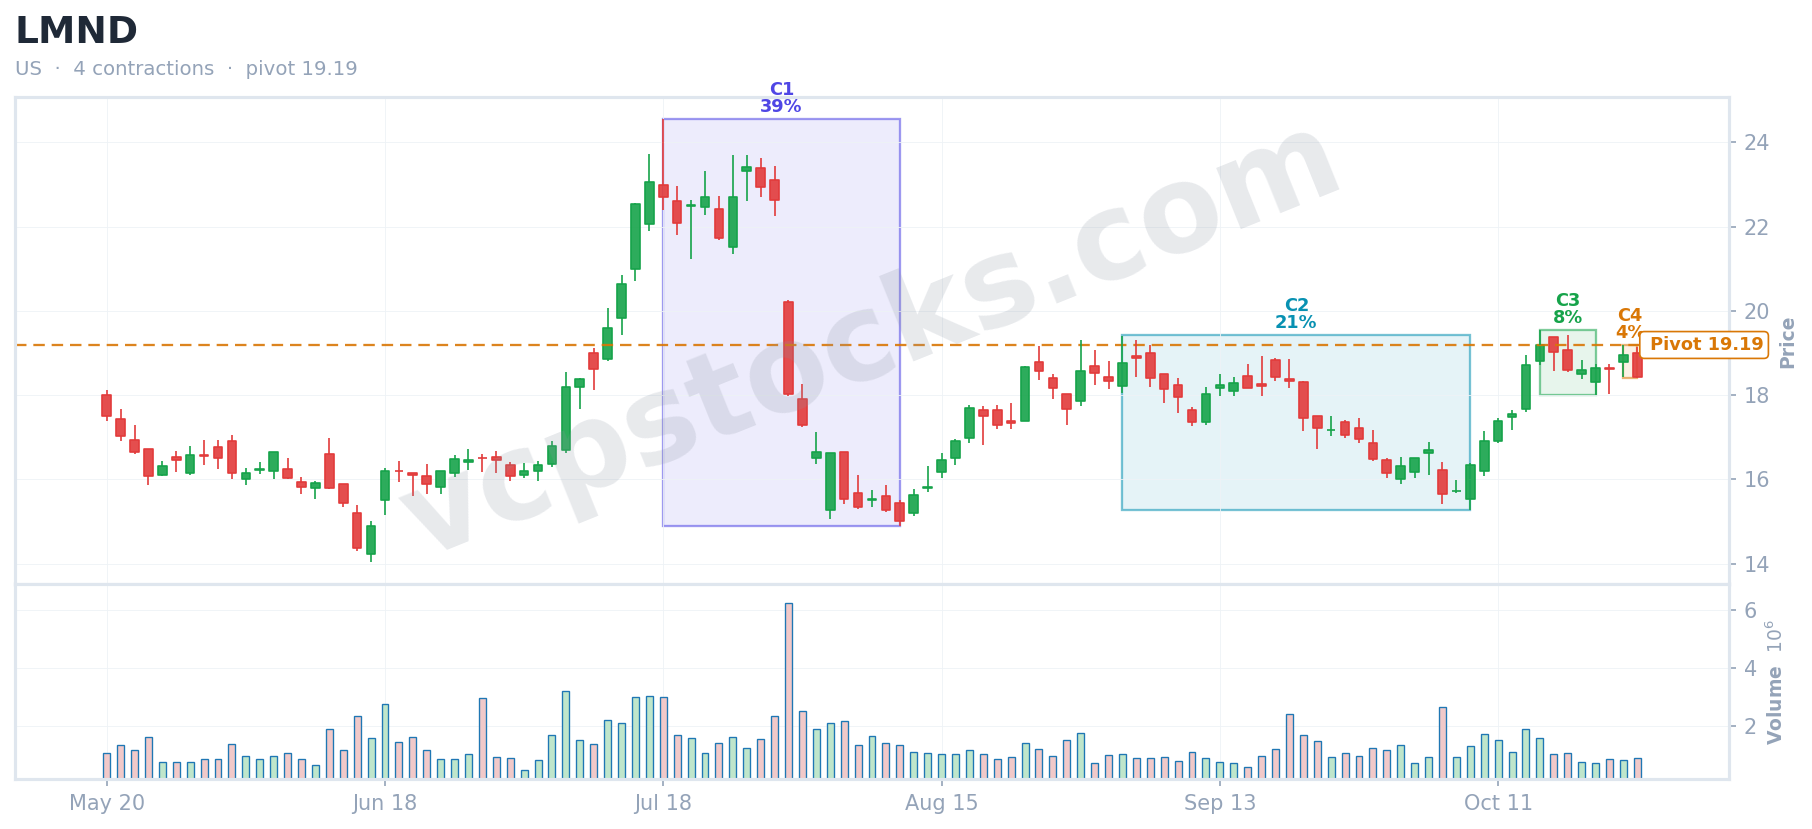
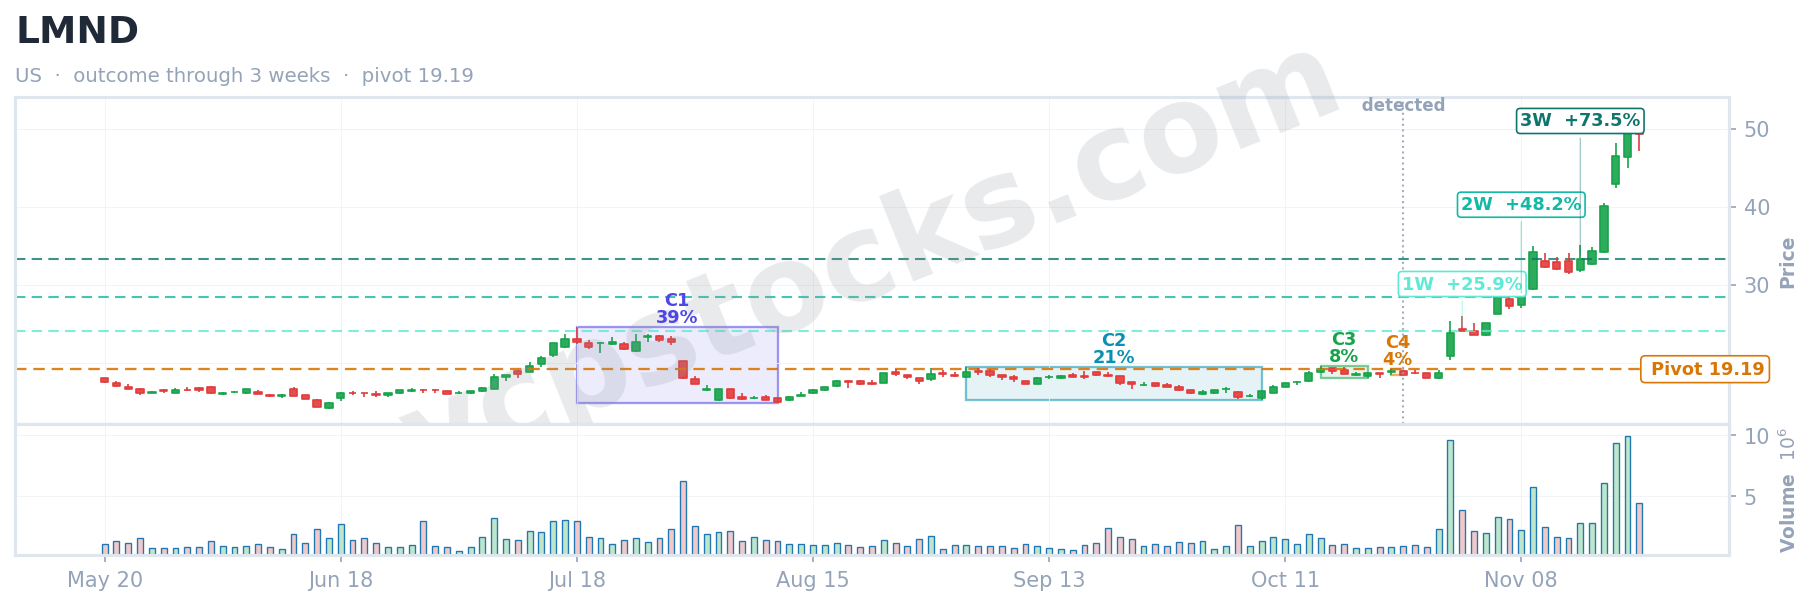
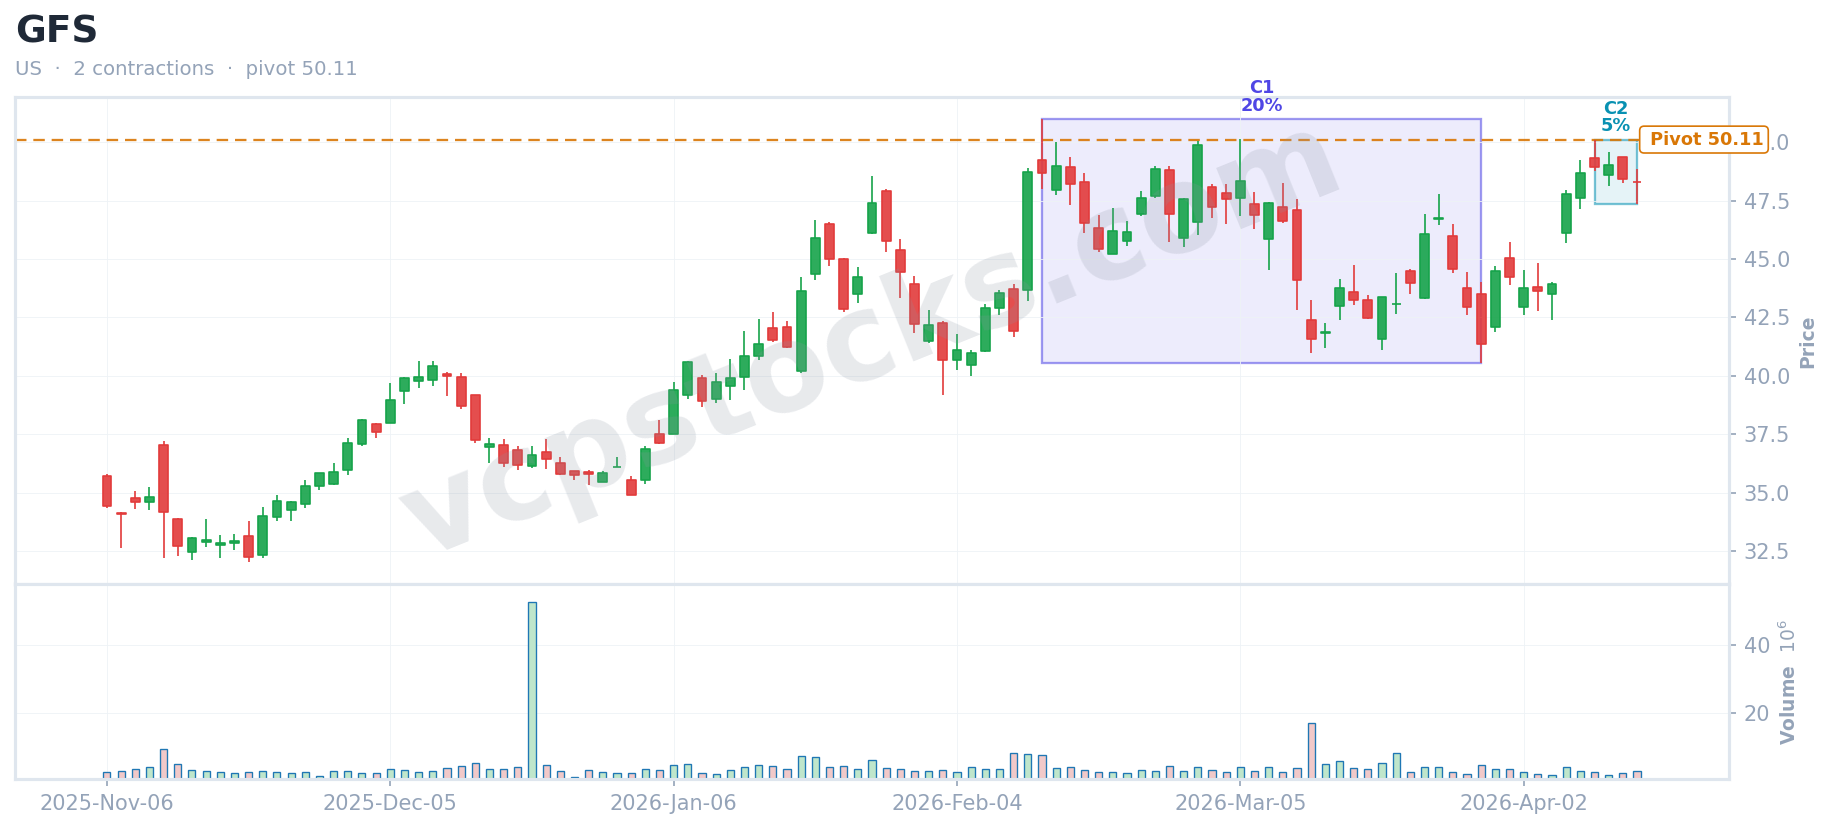
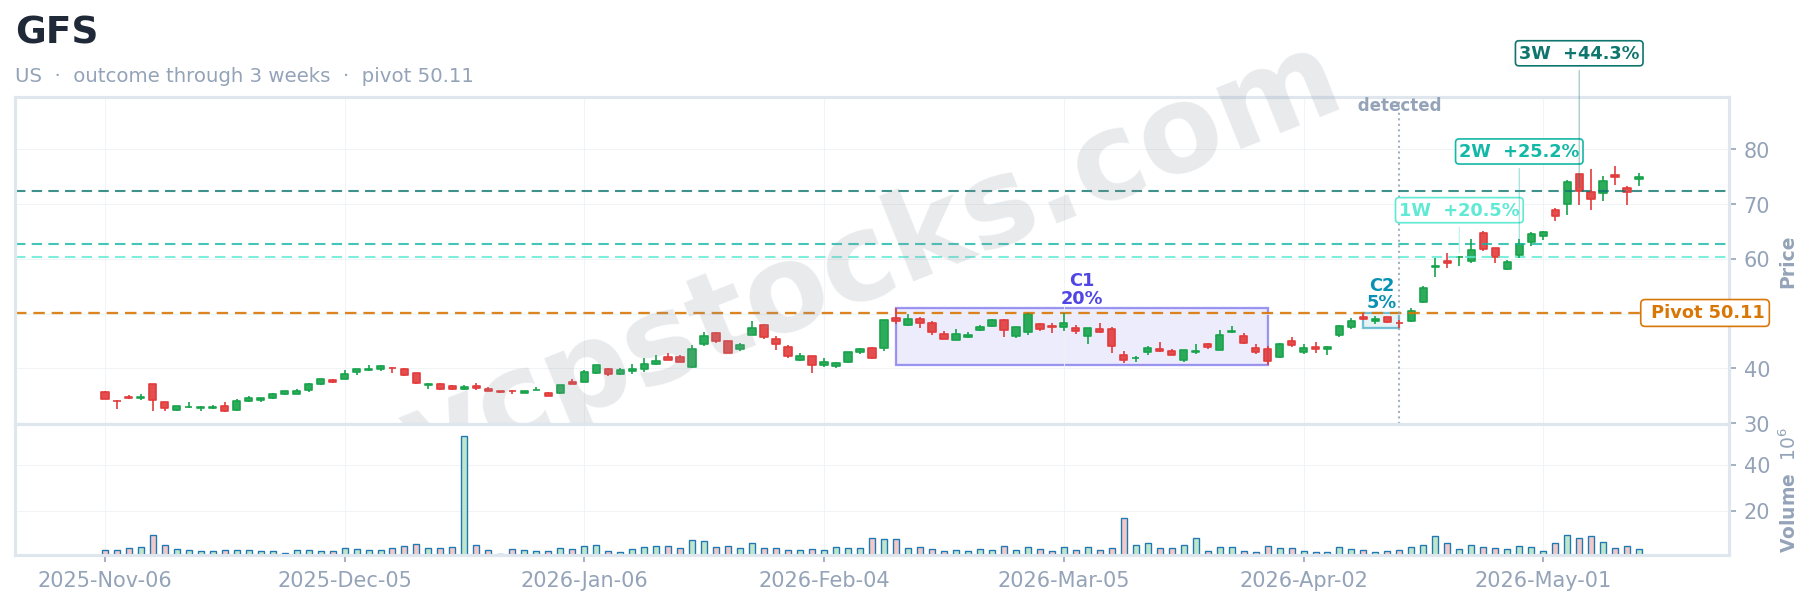
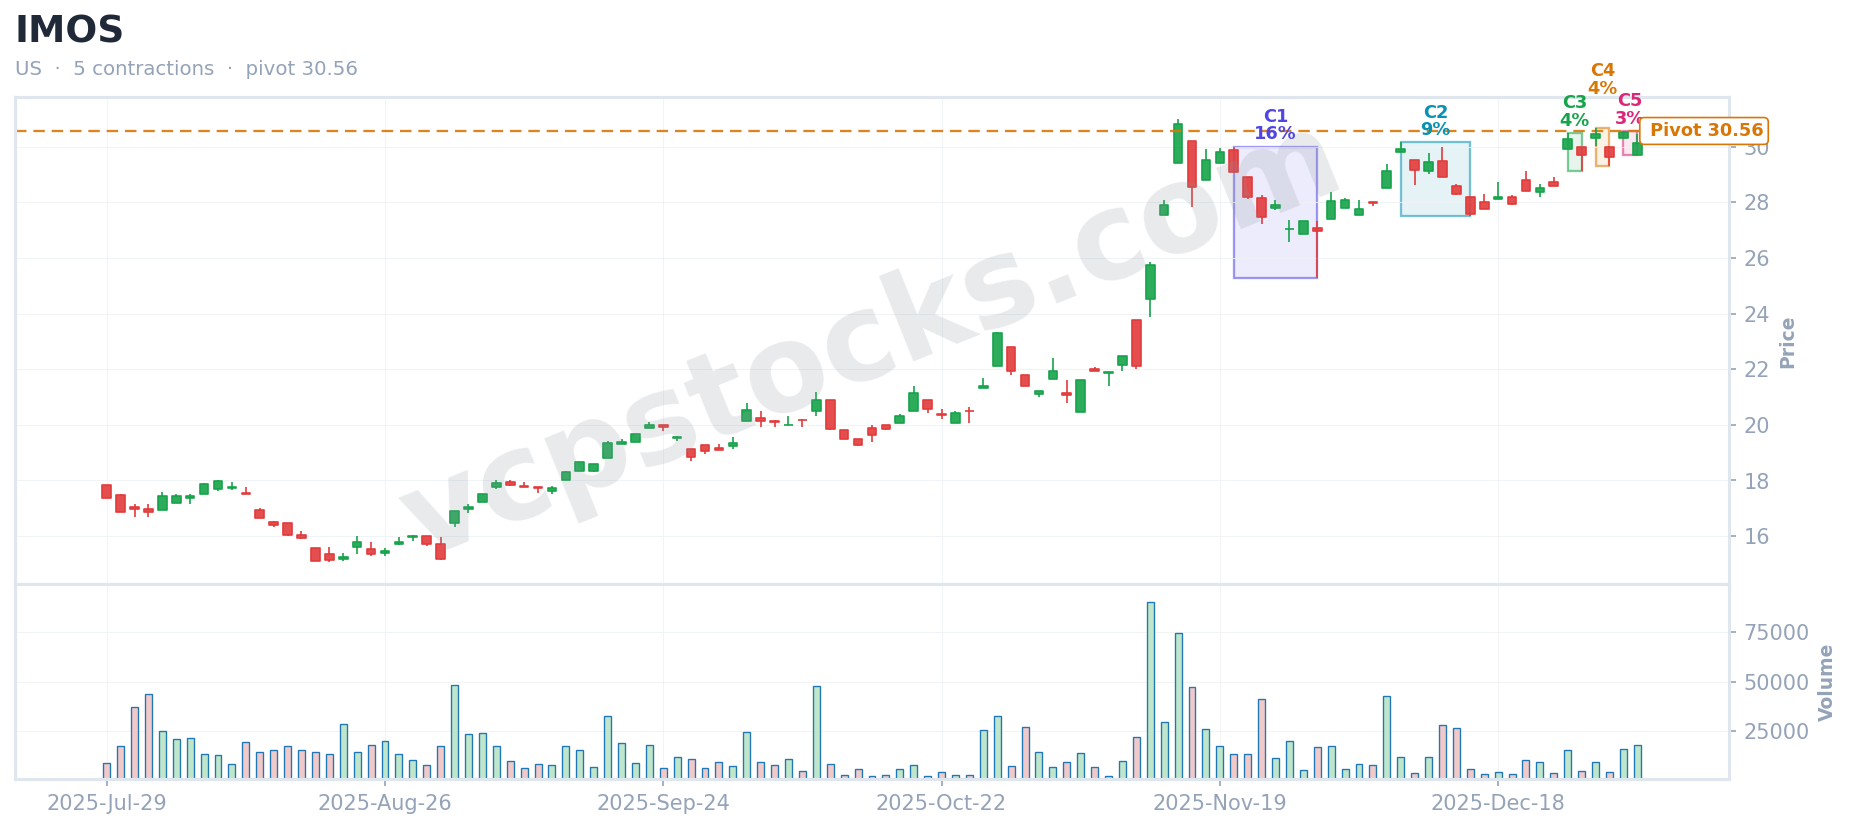
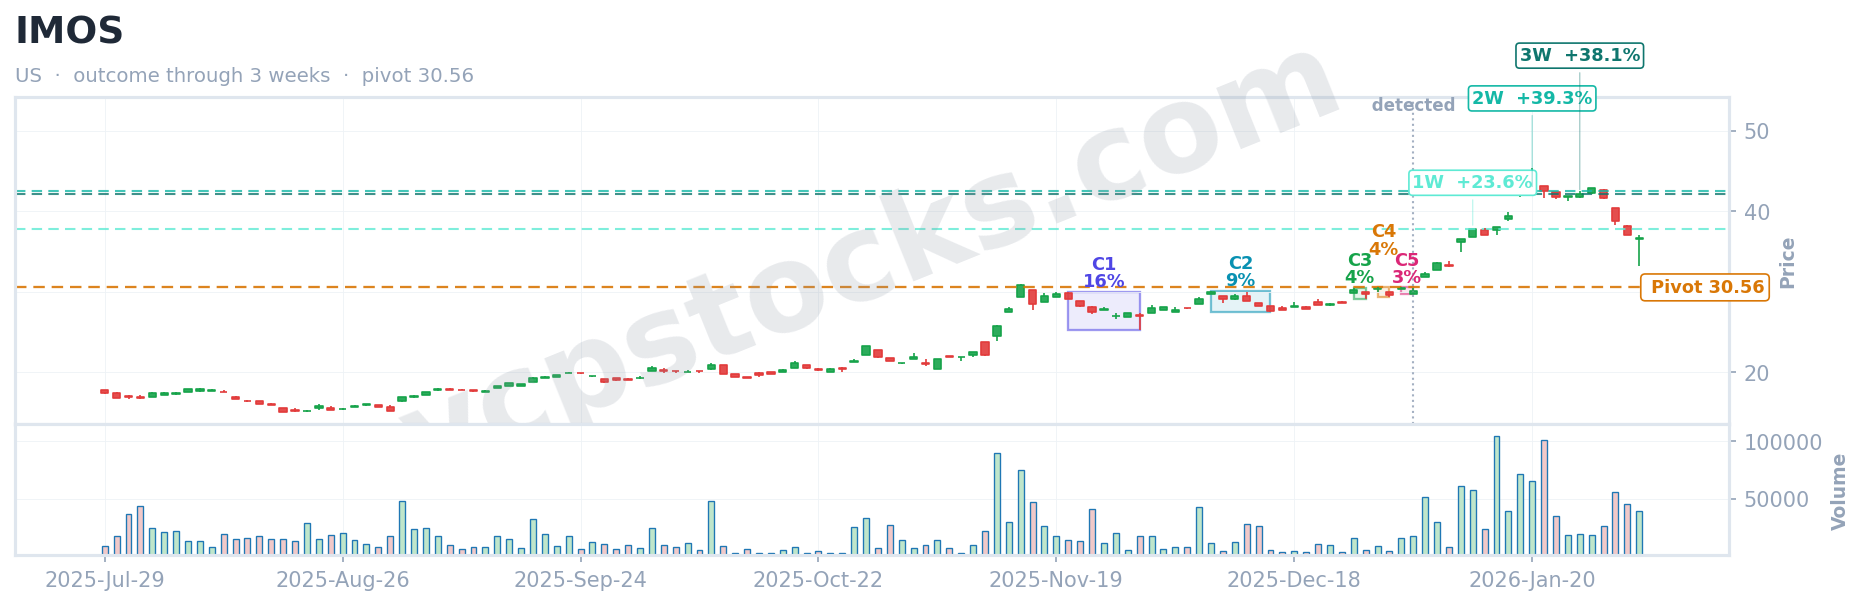
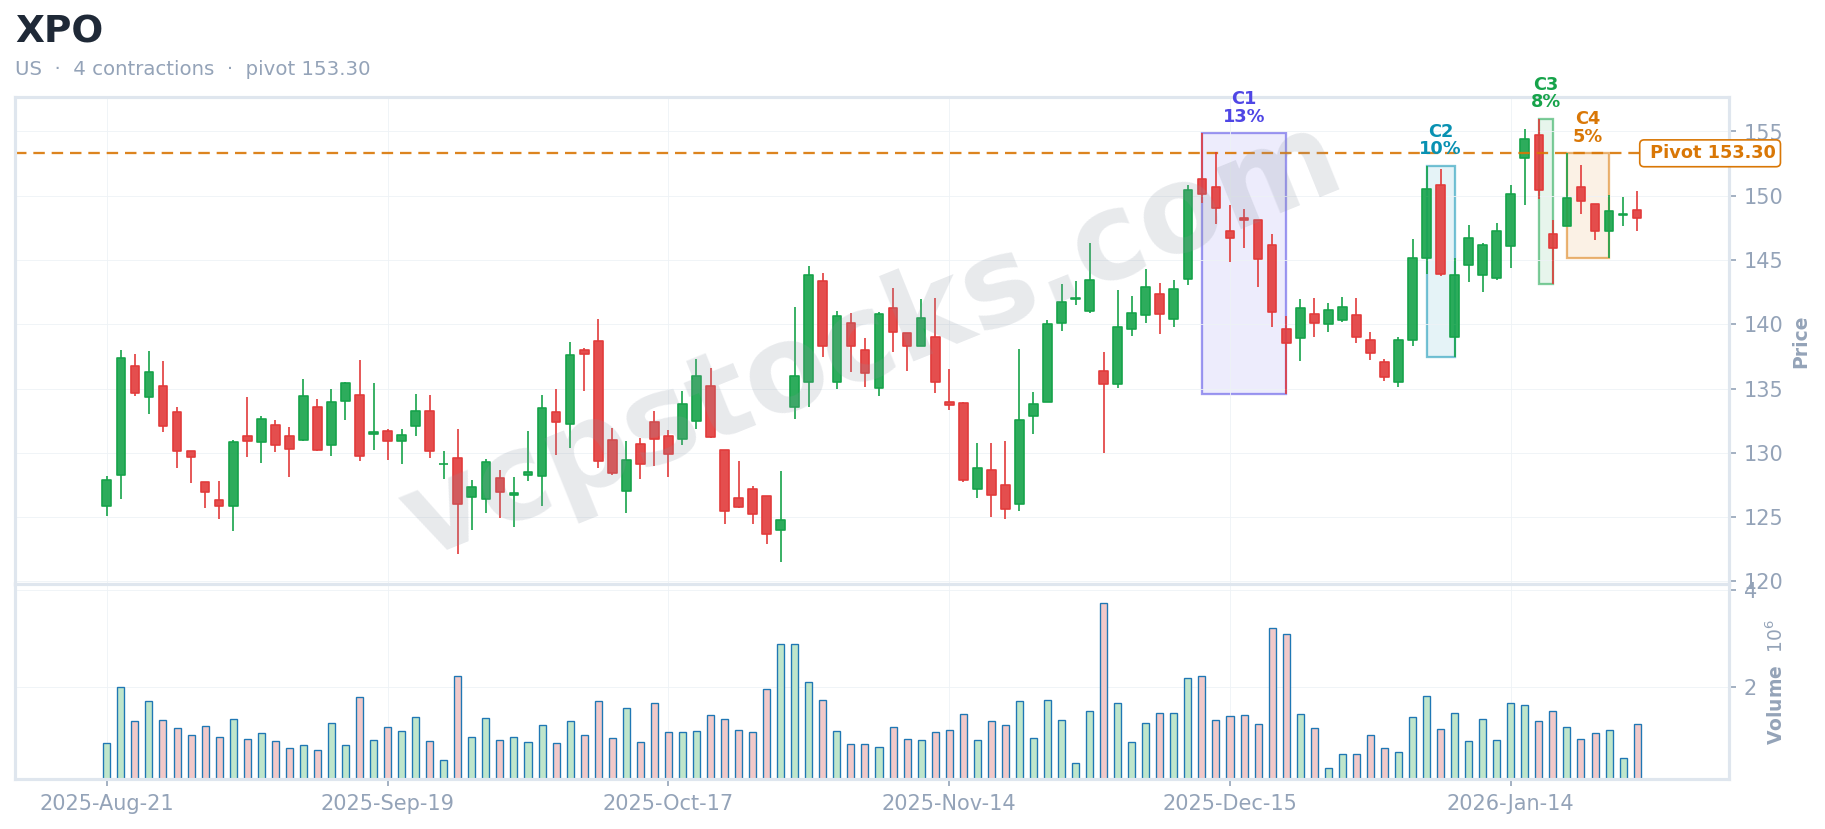
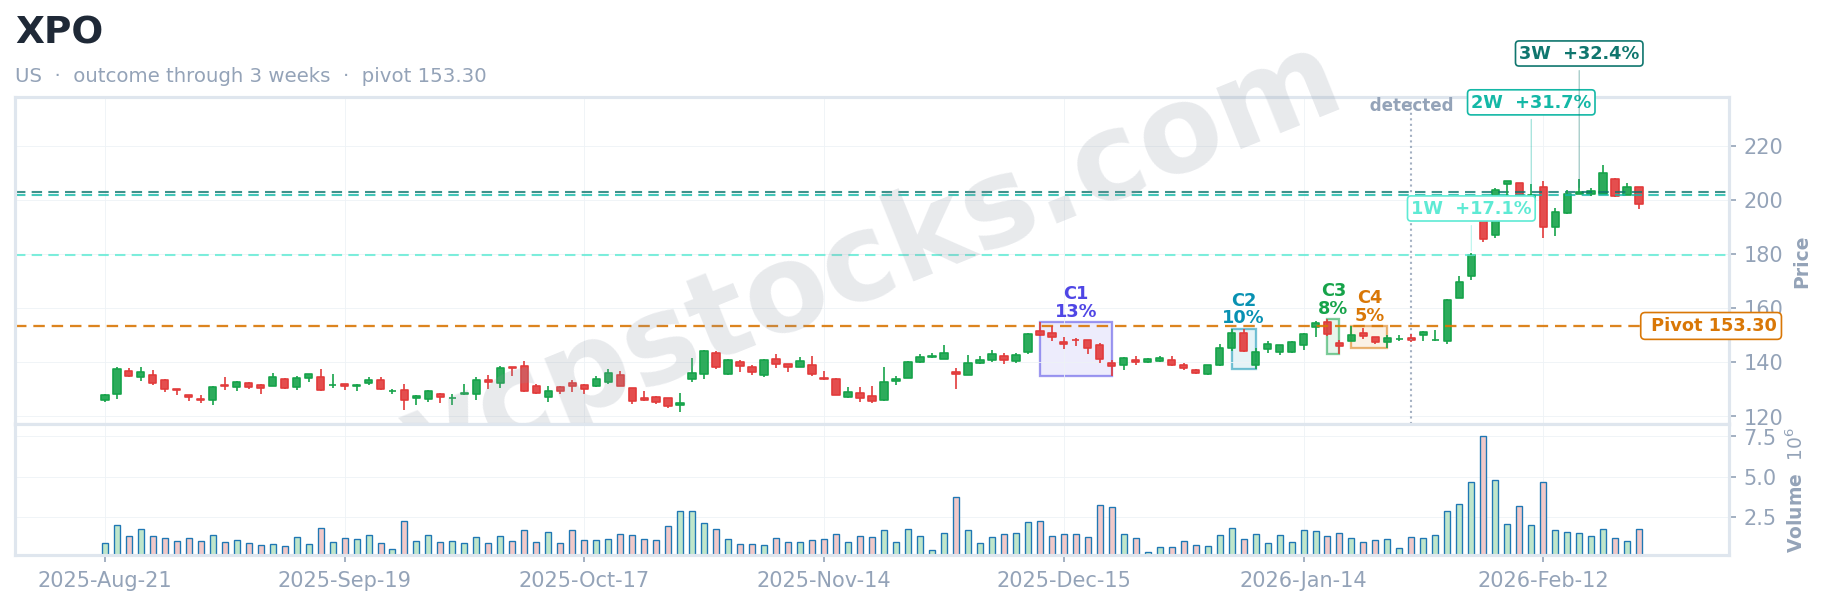
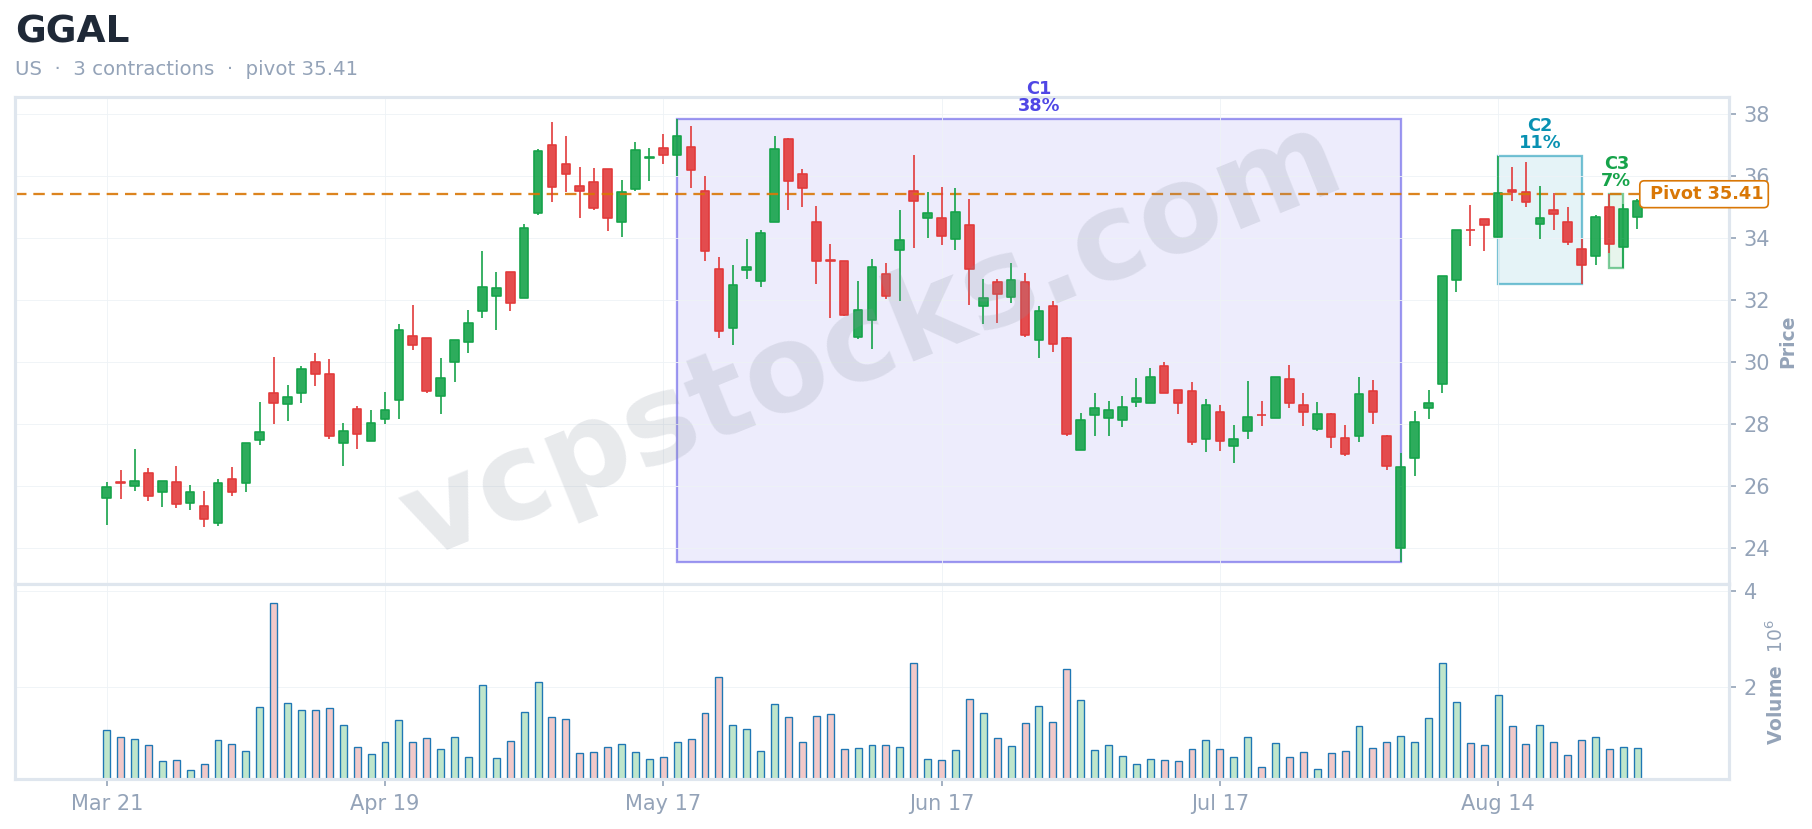
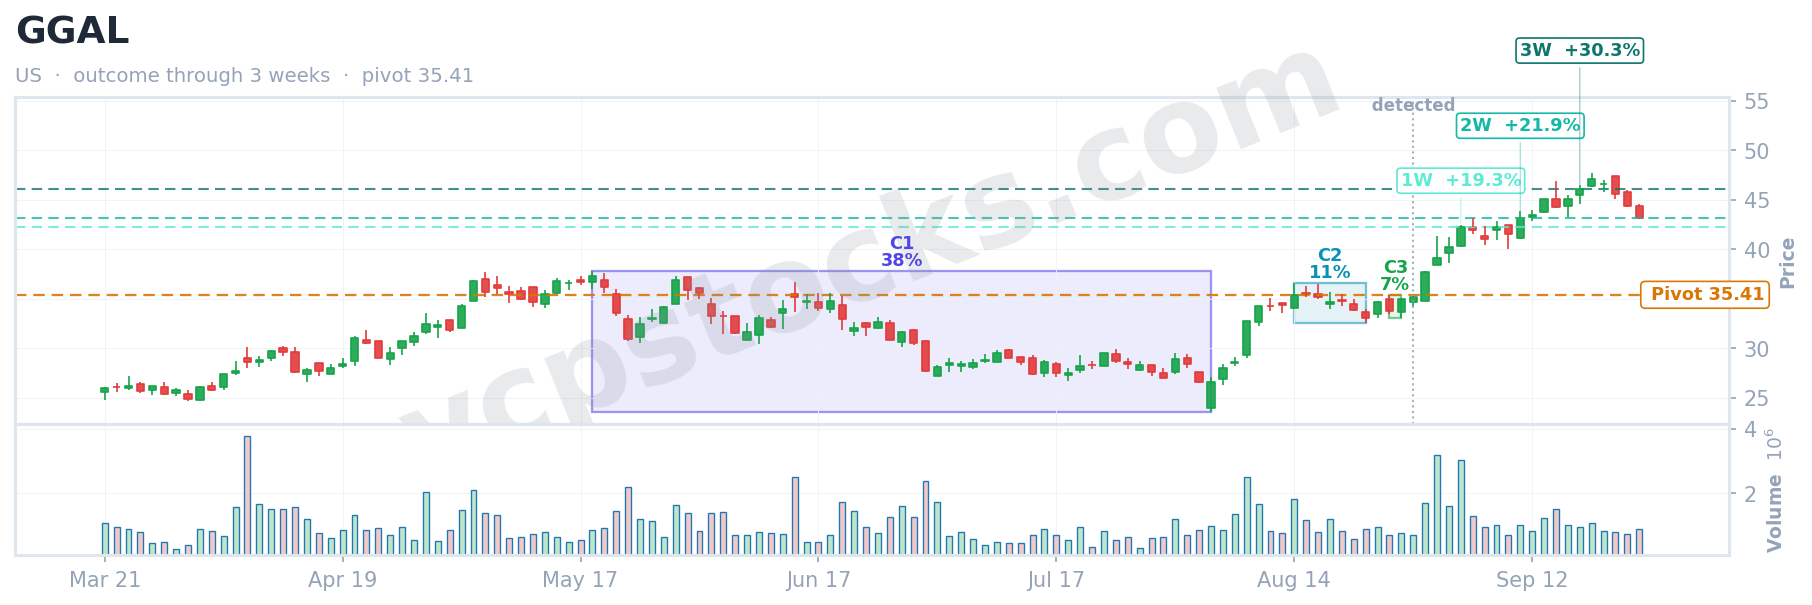
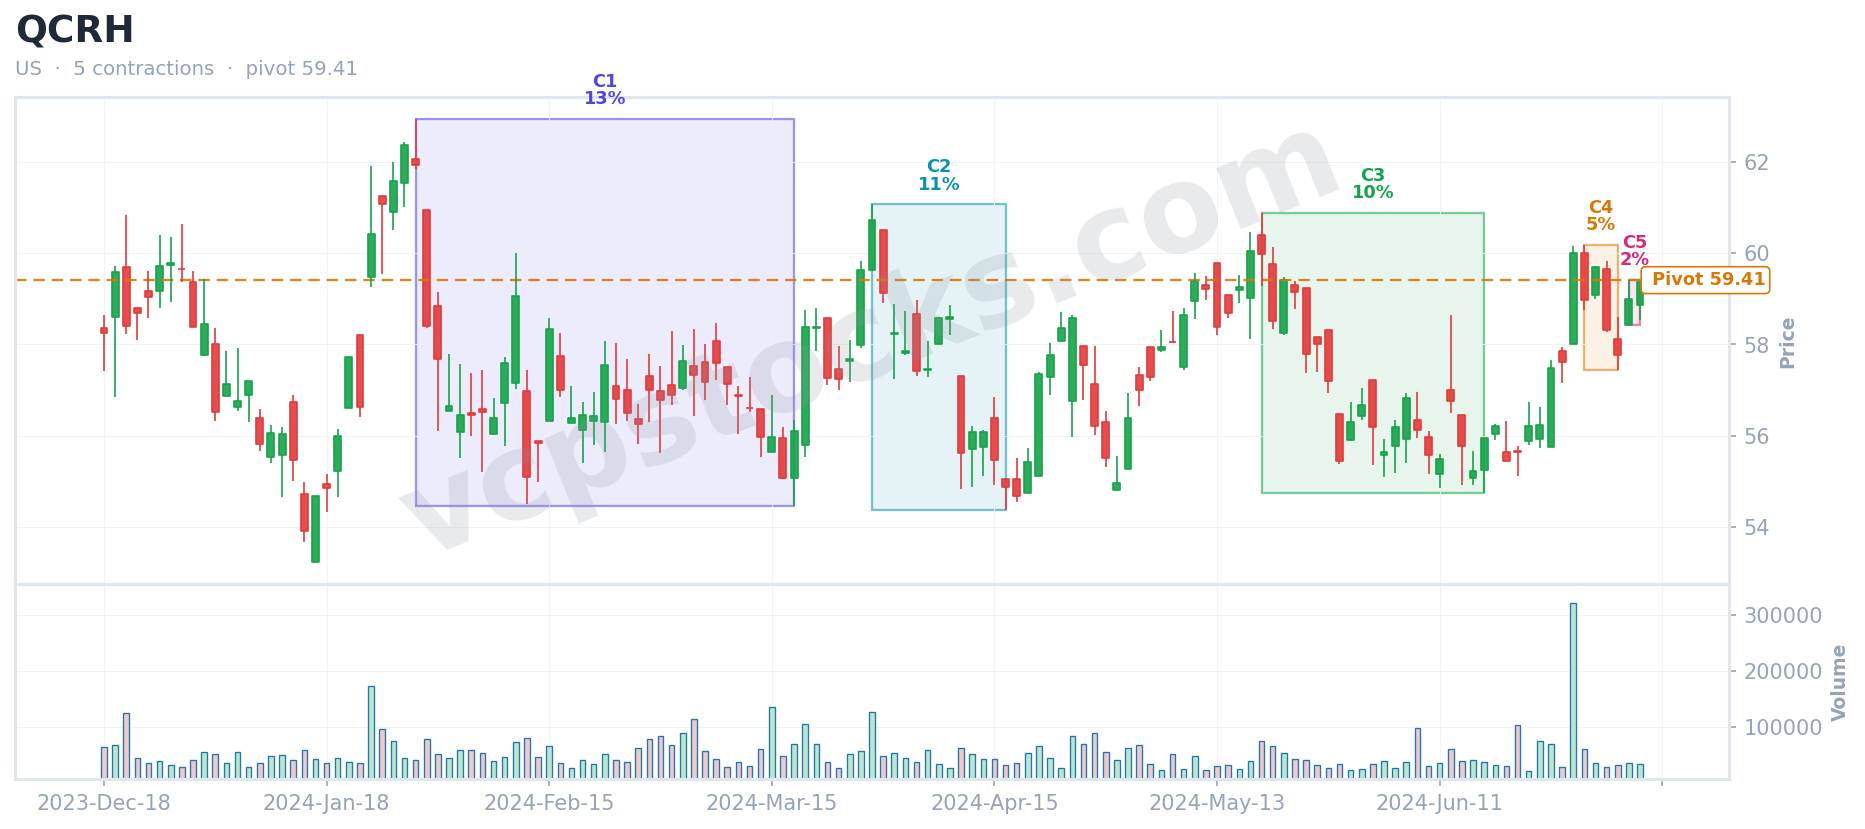
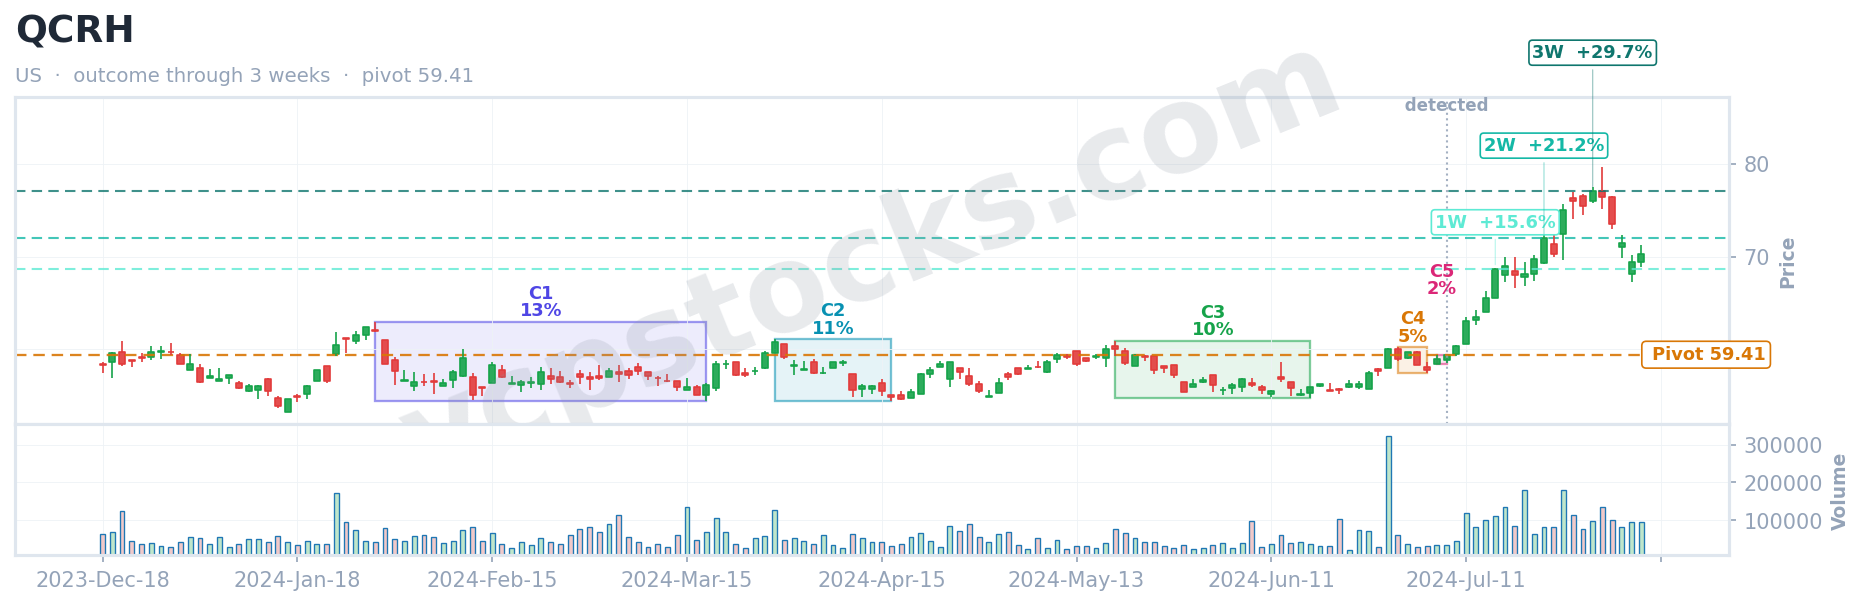
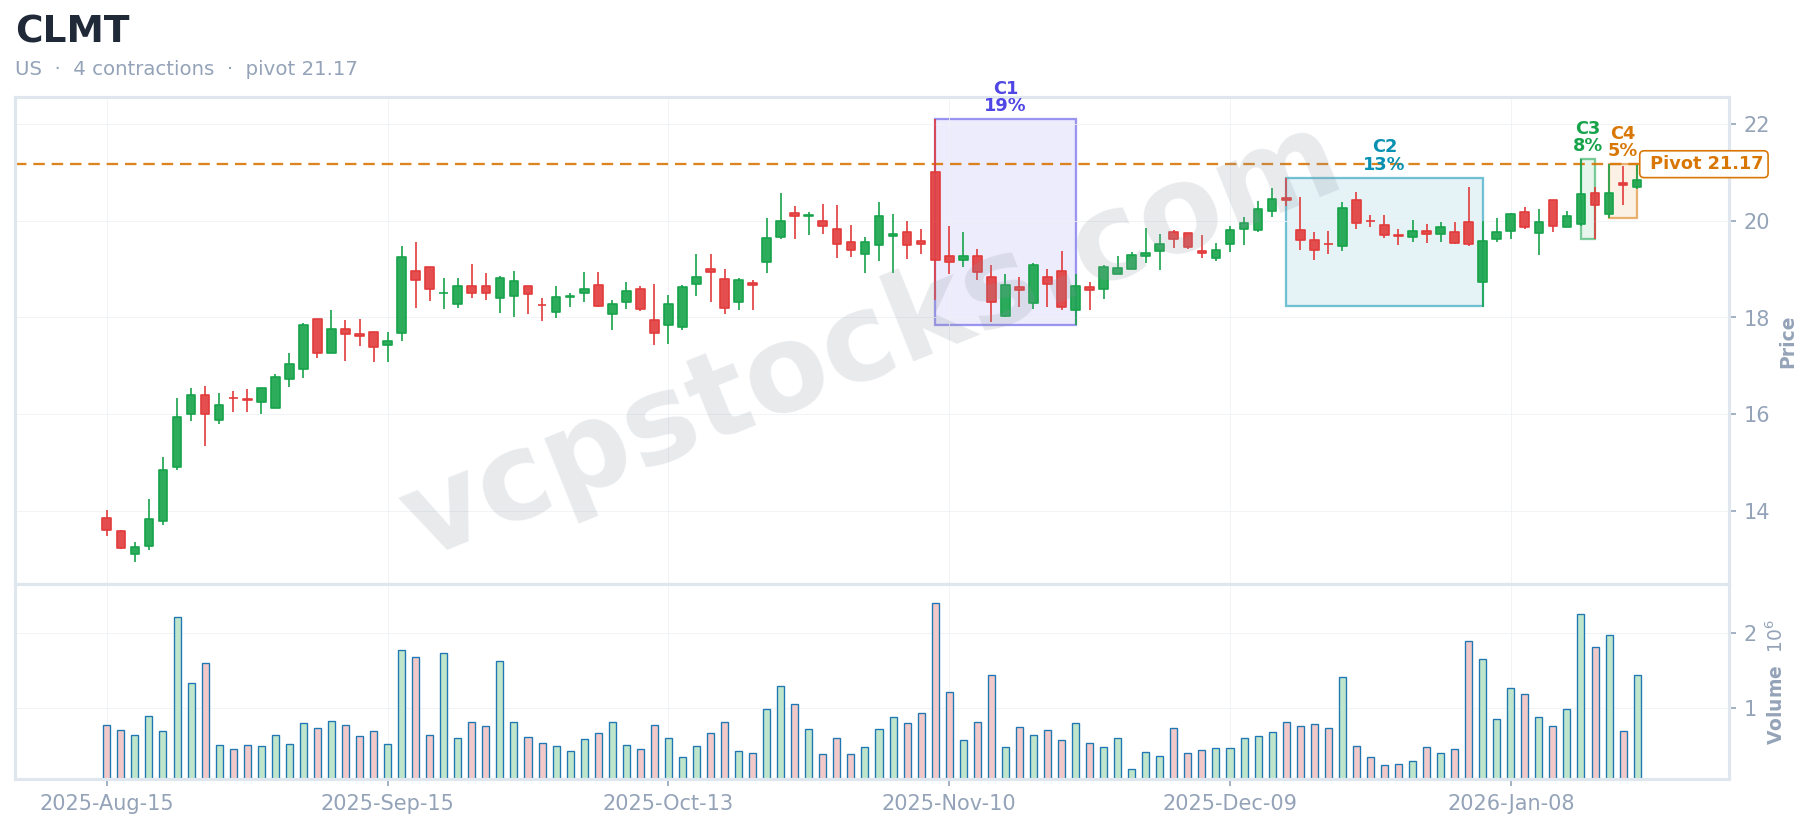
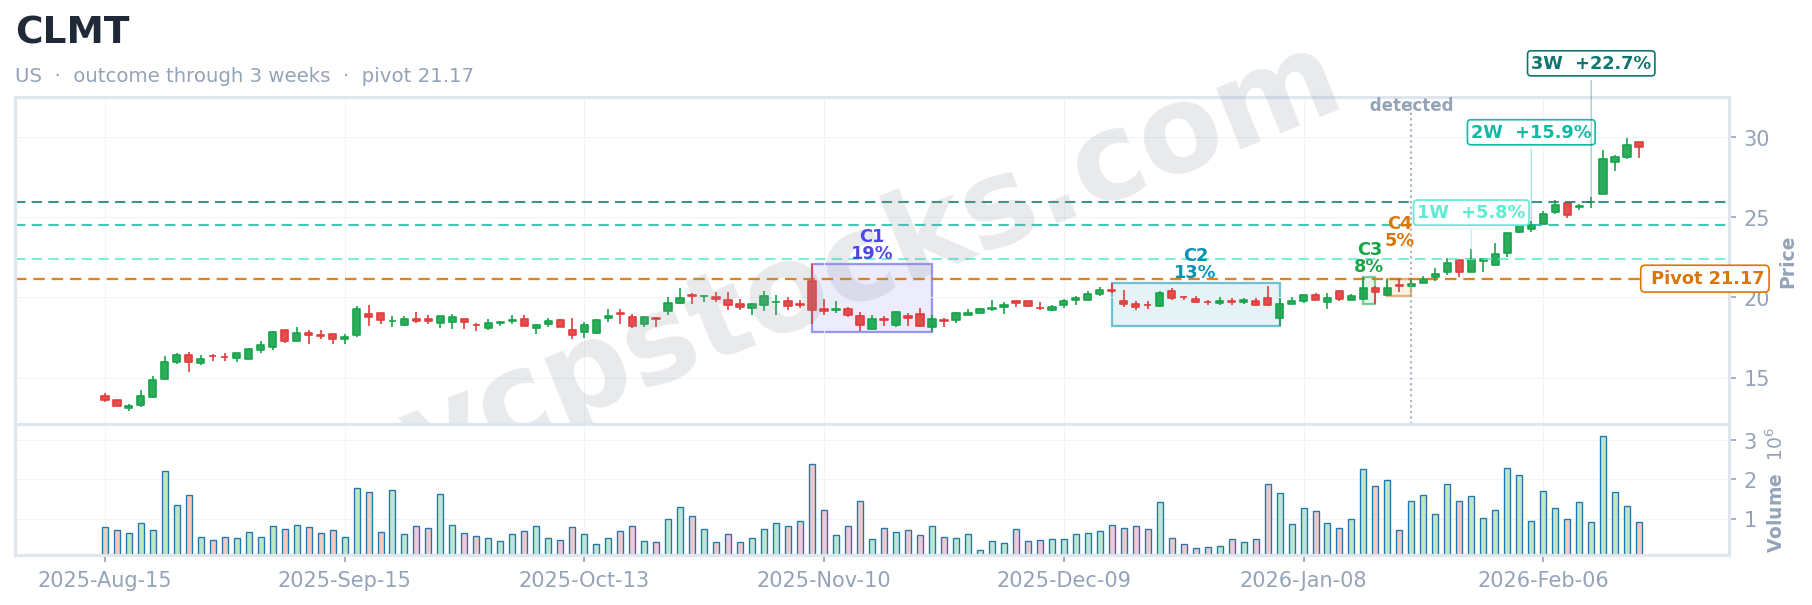
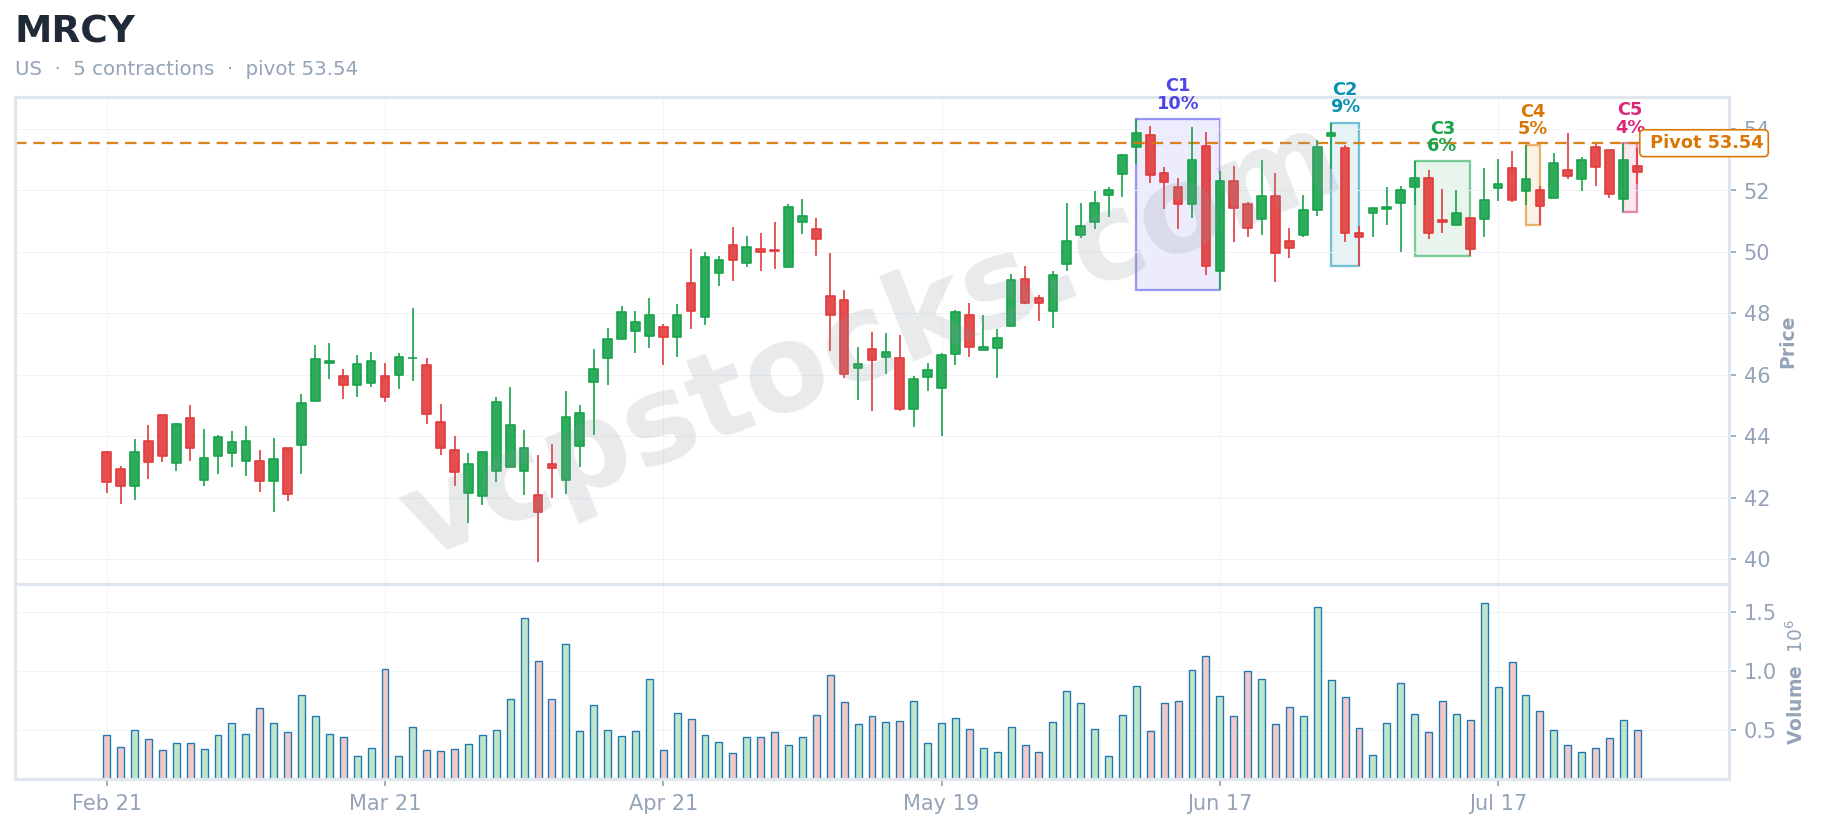
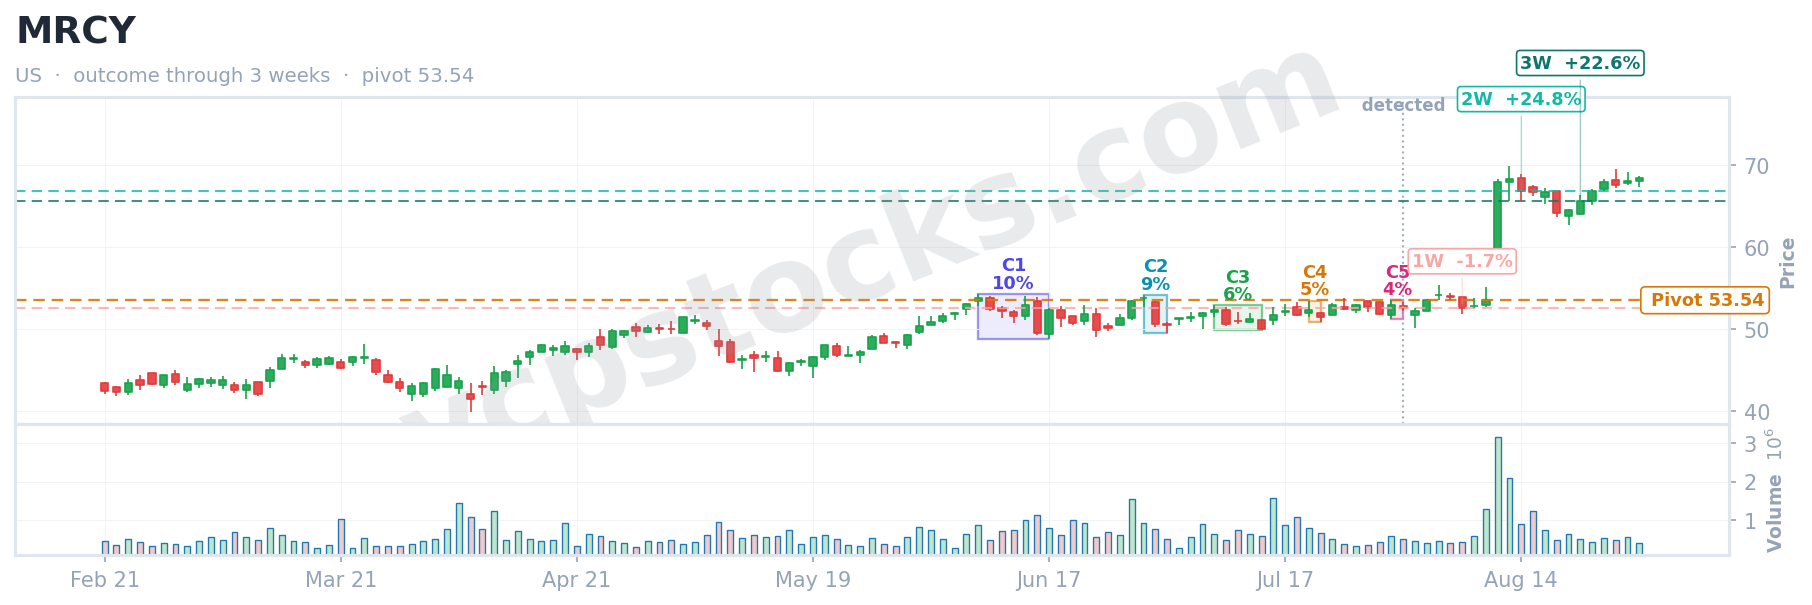
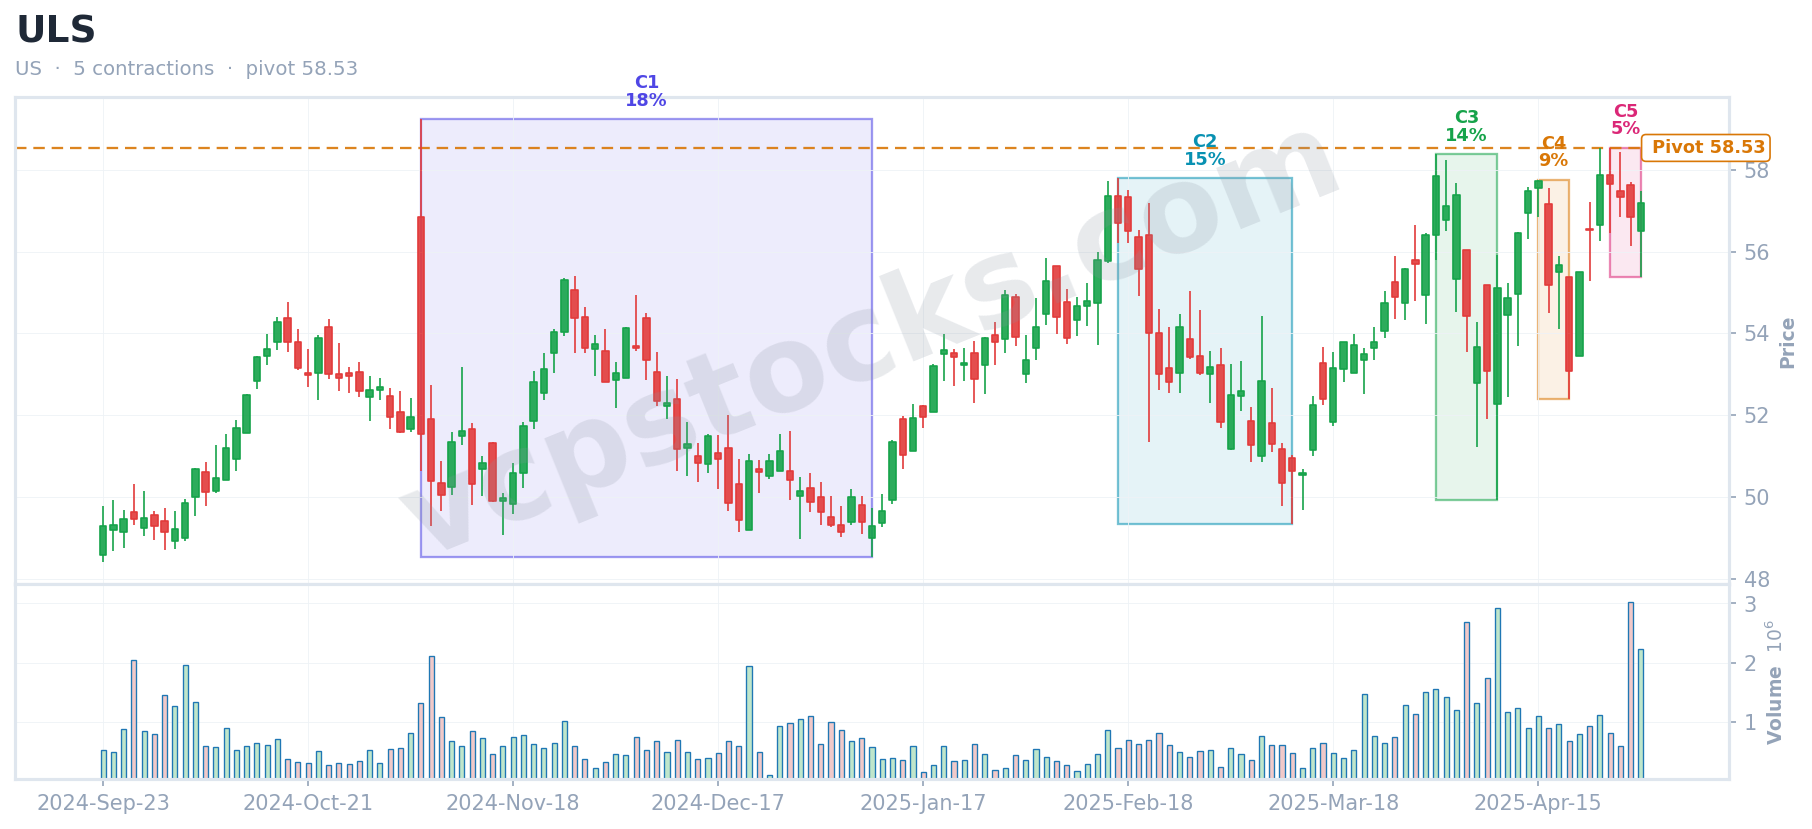
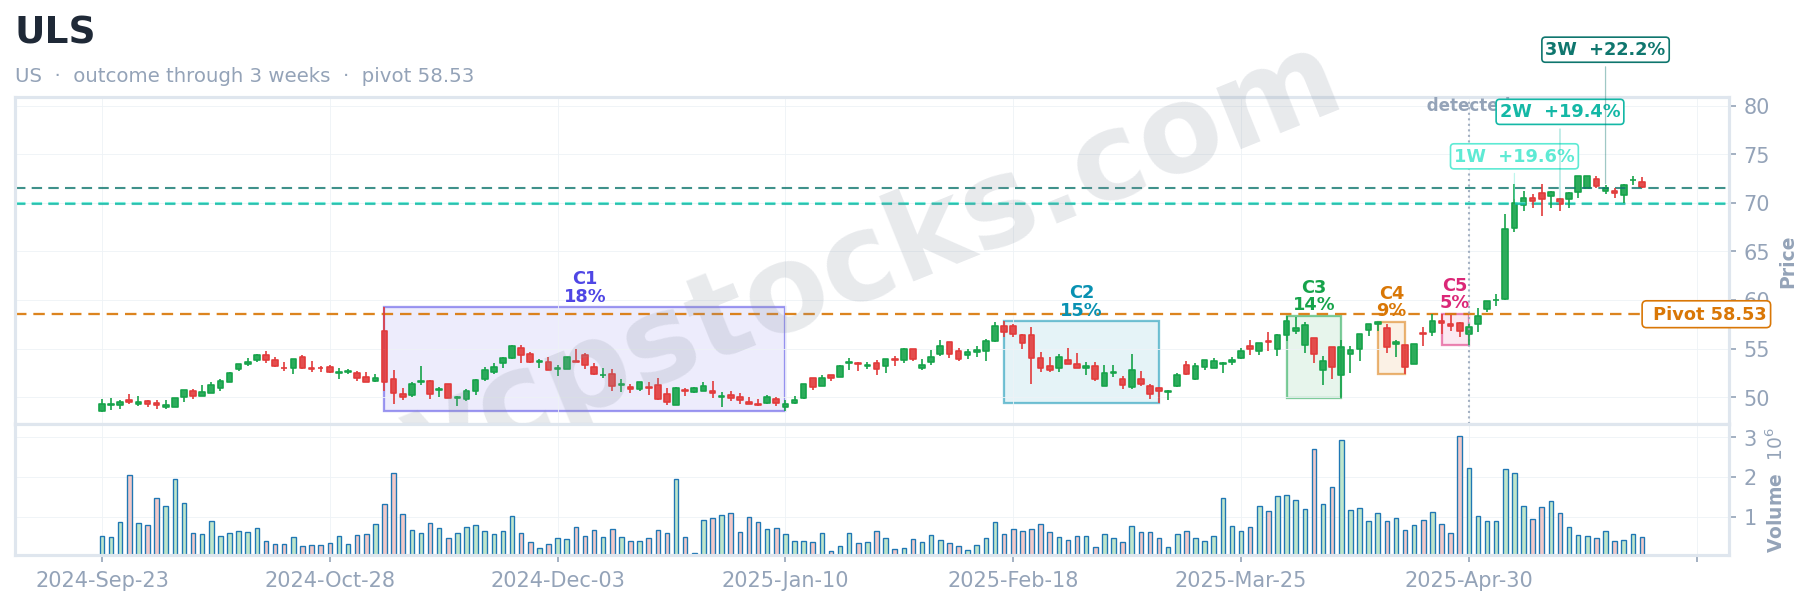
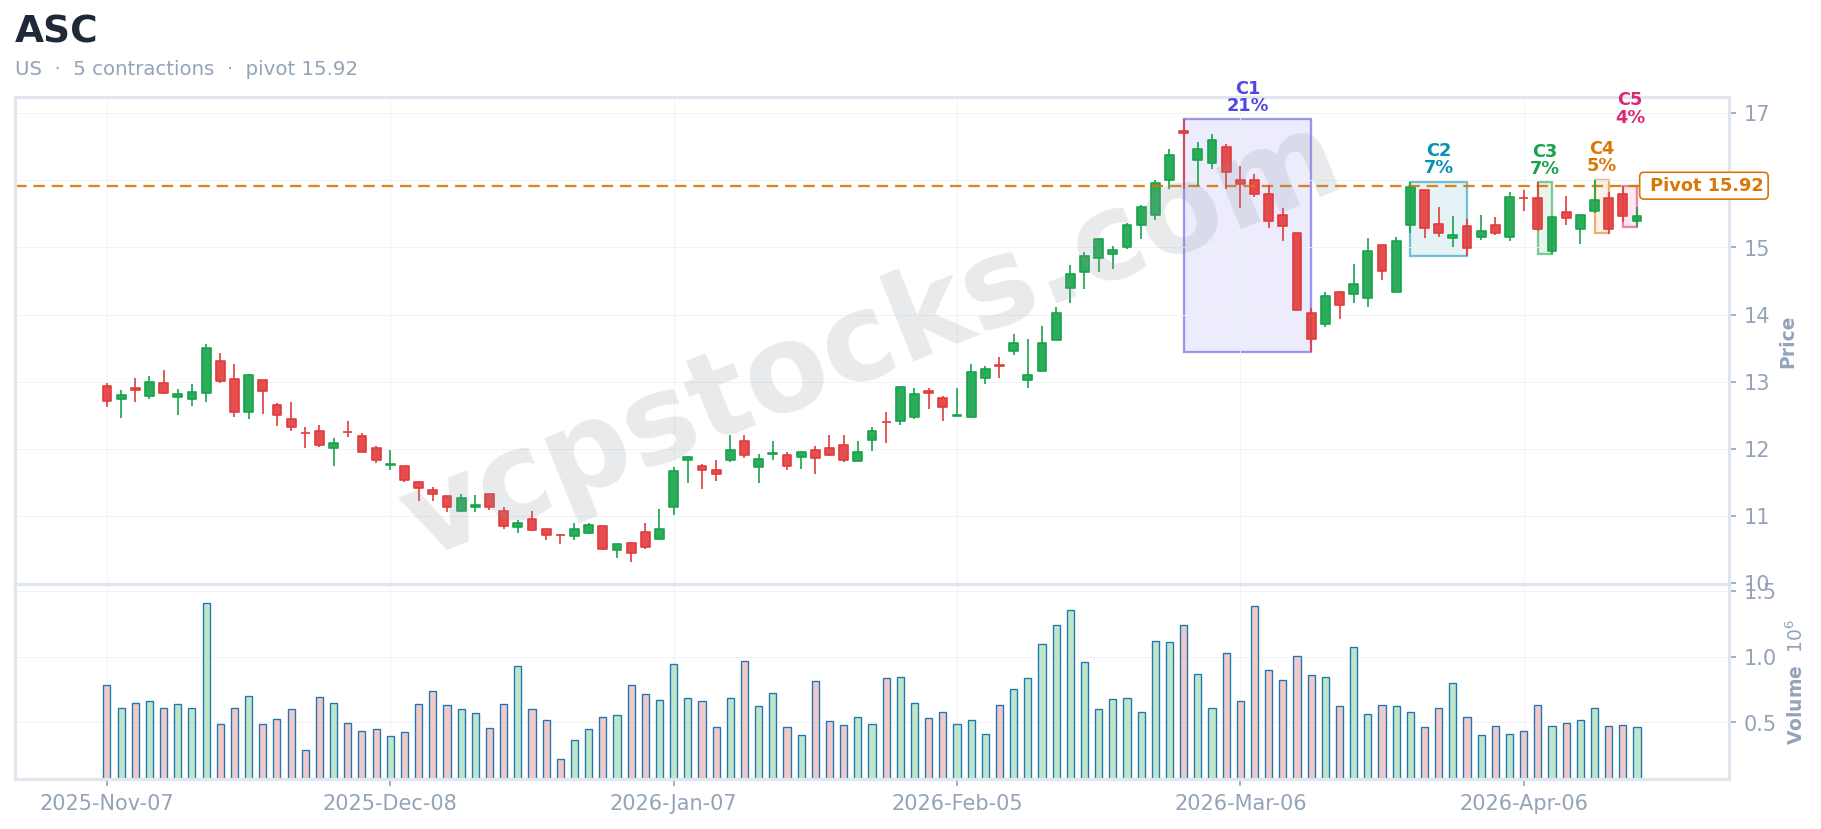
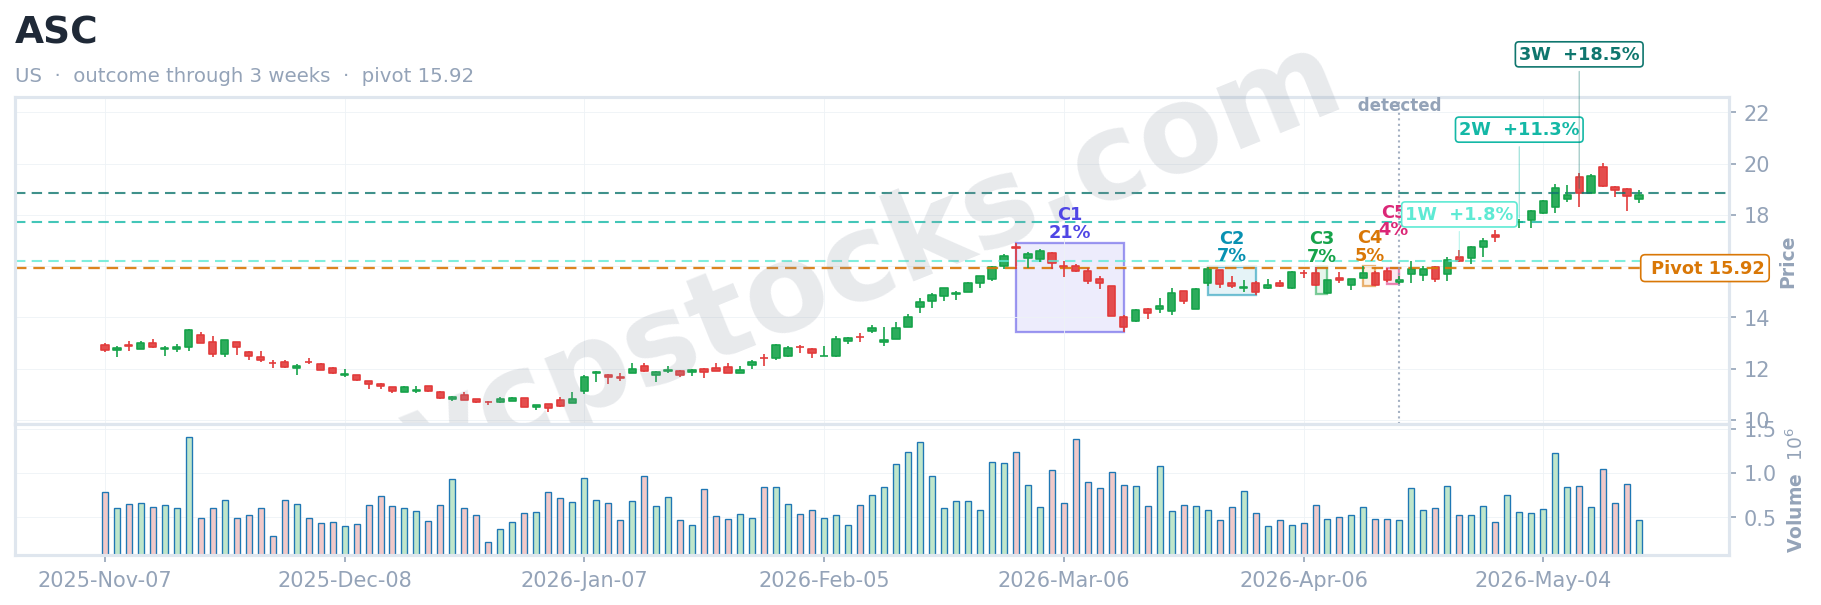
Real Volatility Contraction Pattern picks from the US market, flagged by our screener before the breakout — not in hindsight. The actual detection chart, then the measured outcome.
Every chart is timestamped at the precise moment our algorithm flagged the setup — nothing is redrawn, backdated, or adjusted after the fact. These are the same real-time signals our members receive every trading day, applying the same rules-based methodology, consistently, across the US market.
How We Identify These Picks
Every pick followed the same repeatable algorithm — no gut feel, no manual guessing.
Screener Flags the Pattern
Our algorithm scans every active US stock daily, looking for tight VCP setups with decreasing volume contractions.
Detection Chart is Saved
At the exact moment the pattern is flagged, we capture the chart. Nothing is redrawn later. This is the evidence you see below.
Outcome is Measured
We track price movement over 1, 2, and 3 weeks following detection. The profit or loss is recorded objectively.
Only Verified Picks Shown
The picks here all had positive outcomes. We show real numbers so you can judge the system for yourself.
Detection Chart → Proven Outcome
Each card shows the VCP setup exactly as our screener detected it, paired with the measurable profit outcome that followed.
The picks shown are historical examples detected by our screener. Provided for informational and educational purposes only — not financial advice. Past performance does not guarantee future results. All investing involves risk.