Looking for Volatility Contraction Pattern (VCP) stocks on the US, India or Taiwan stock market?
VCP Pattern Scanner/Screener Service for you. The Winning Trading Pattern used by the US Investing Championship Mark Minervini!
Ease your pain to screen and find VCP stocks from thousands of US/India/Taiwan stocks.
Subscribe to our Service
Choose the most suitable service plan (Basic or Professional) and make subscription to it.
Receive our Daily VCP stock list email
As long as your subscription is active, you will receive our VCP stock list by email before the stock market start time on each trading date.
Start trading with VCP stocks
Now based on what you understand with VCP, you can fully utilize our VCP stock screen result and make your own trading decisions.
Our system engine will look for Volatility Contraction Pattern (VCP) among all currently active US/India/Taiwan stocks
So many people know the magic power of VCP, but not many people have time to find them out. We are here to help you do this on EVERY trading date!
-
You are ready to beat 90% of the traders on the market!
-
Simply set up a buy stop order above the pivot/breakout point of the VCP stock.
-
Wait for the buy stop order to be triggered. After buying, don't forget to set up a sell stop order on the price just below the last contraction for protection. That's how Mark Minervini tell us!
What our engine scans
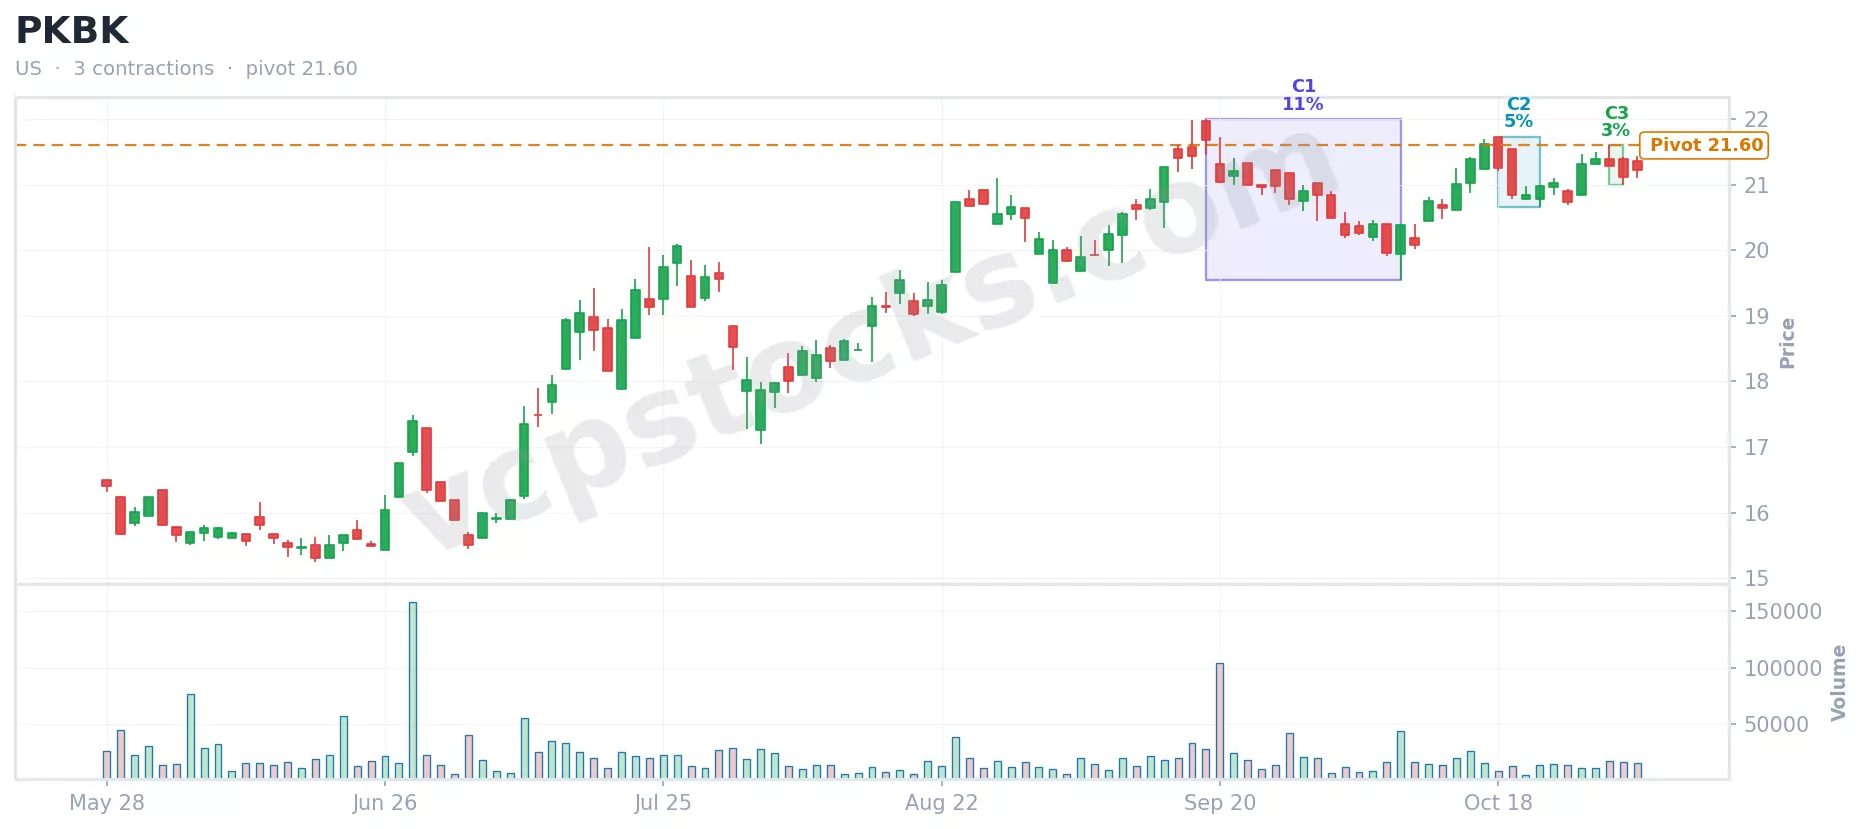
Magic power of Volatility Contraction Pattern (VCP)
A little recap of what Mark Minervini teach us on his book series "Trade Like a Stock Market Wizard"
In Stage 2 - Uptrend stage
We should not buy any stock that is not in stage 2 (Uptrend stage) even it has Volatility Contraction Pattern (VCP). Don't worry, the VCP stock list we found for you must be in stage 2.
The Line of Least Resistance
This term is defined by legendary trader Jesse Livermore and Mark Minervini keeps using it. In terms of VCP, we should see a movement from greater volatility on the left side of the price base to lesser volatility on the right side. Comparing to the situation where strong investors are replacing weak traders and supply is absorbed. This line of least resistance will be formed once the "weak hands" have been eliminated.
Little buying power results in a great stock price increase
Recall the metaphor by Mark Minervini: Imagine you've soaked a towel in water (selling pressure) and then wrung it out. You need to retwist (contraction) the towel more than 1 time to get all the water all. Finally, the towel become dry and much lighter. At the end, the line of least resistance is formed. With only a little buying power, the stock price can easily go up high.
Entry point with lowest risk
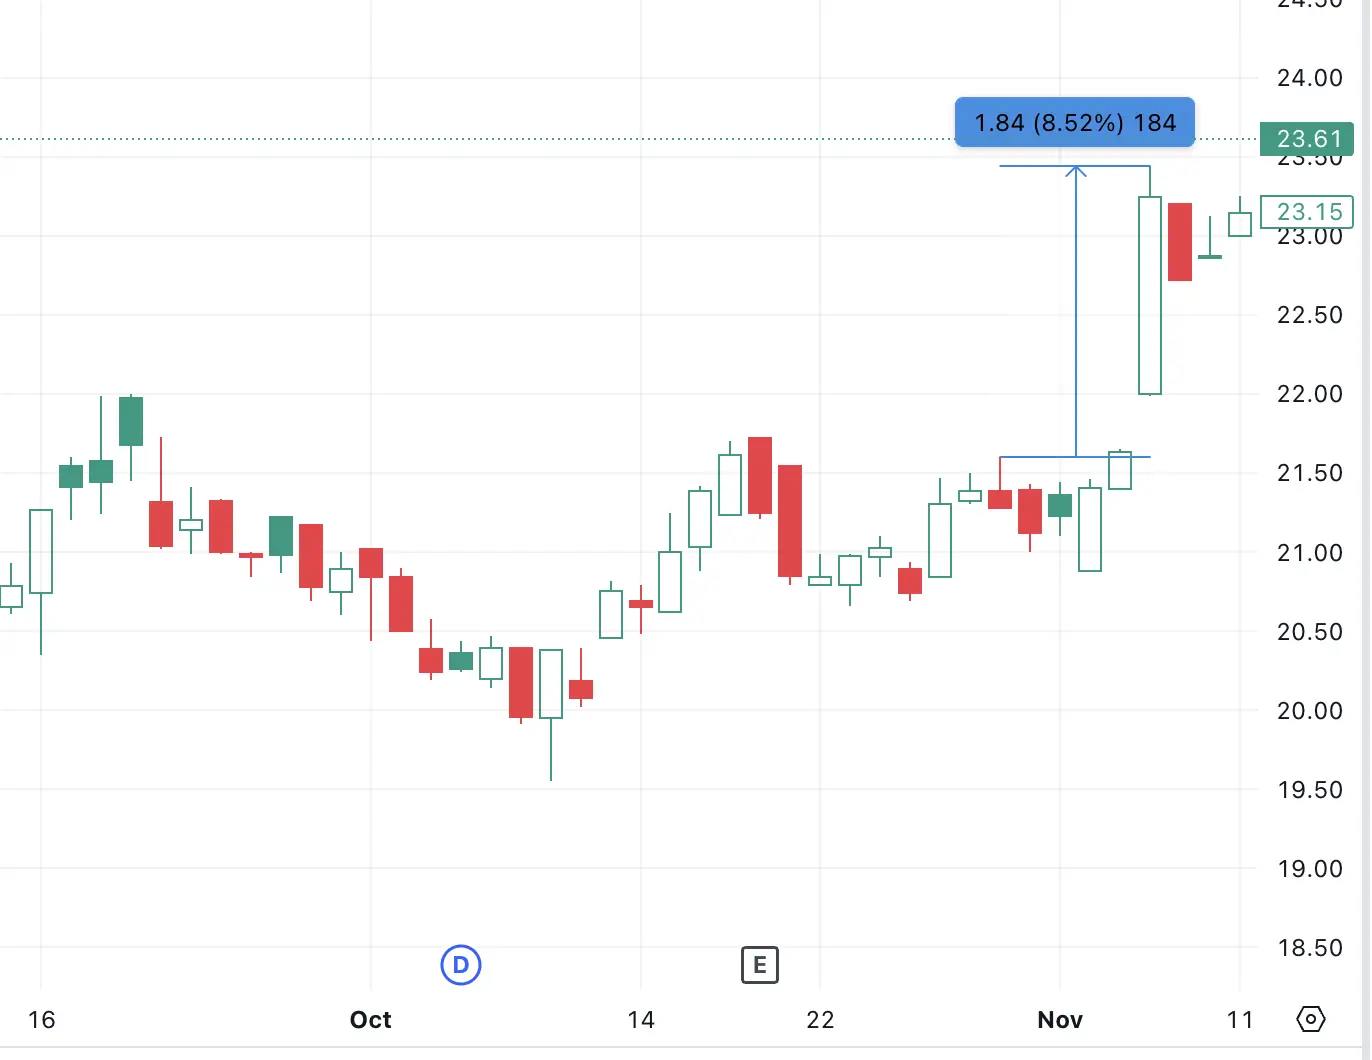
With the above 3 points, it's expected that by waiting for a breakout at the pivot point on the VCP stock, we can easily enjoy a great amount of upward price. With the use of sell stop loss order below the last contraction, we can control our risk to reward ratio.
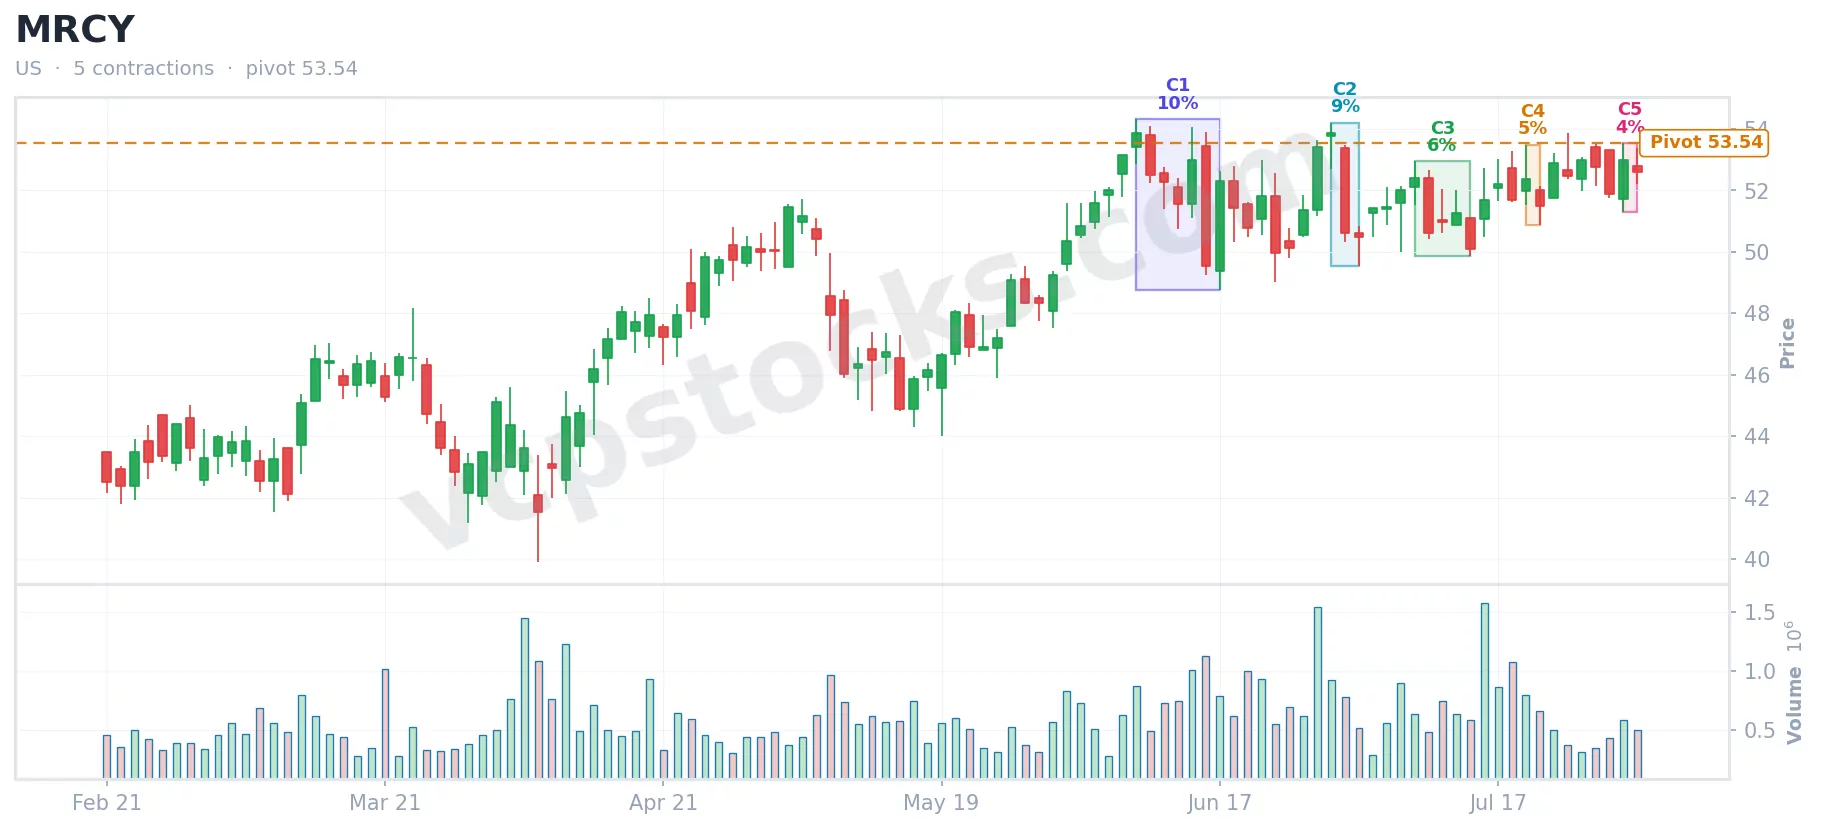
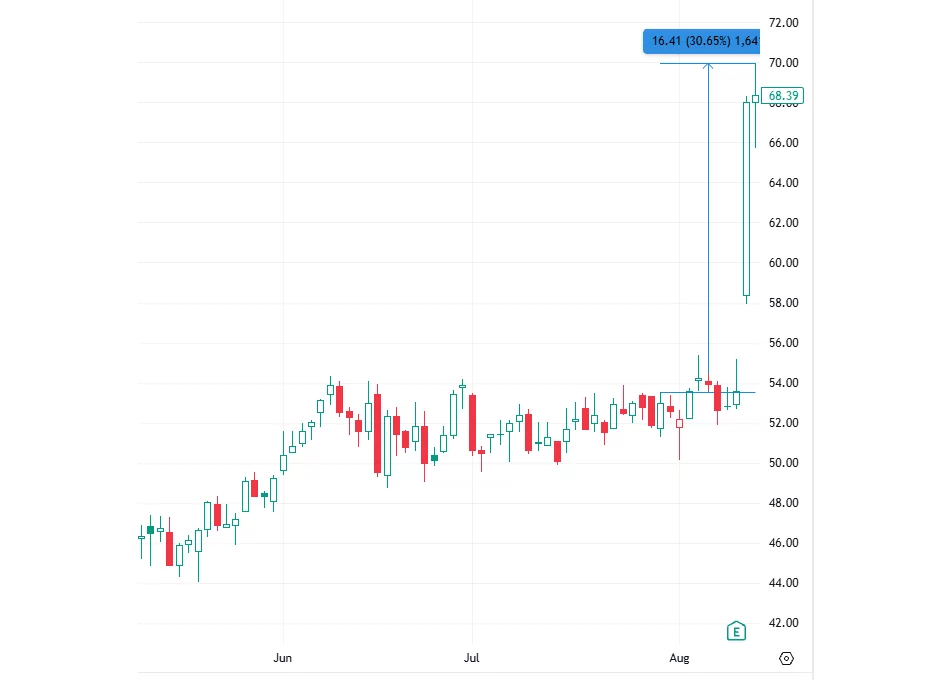
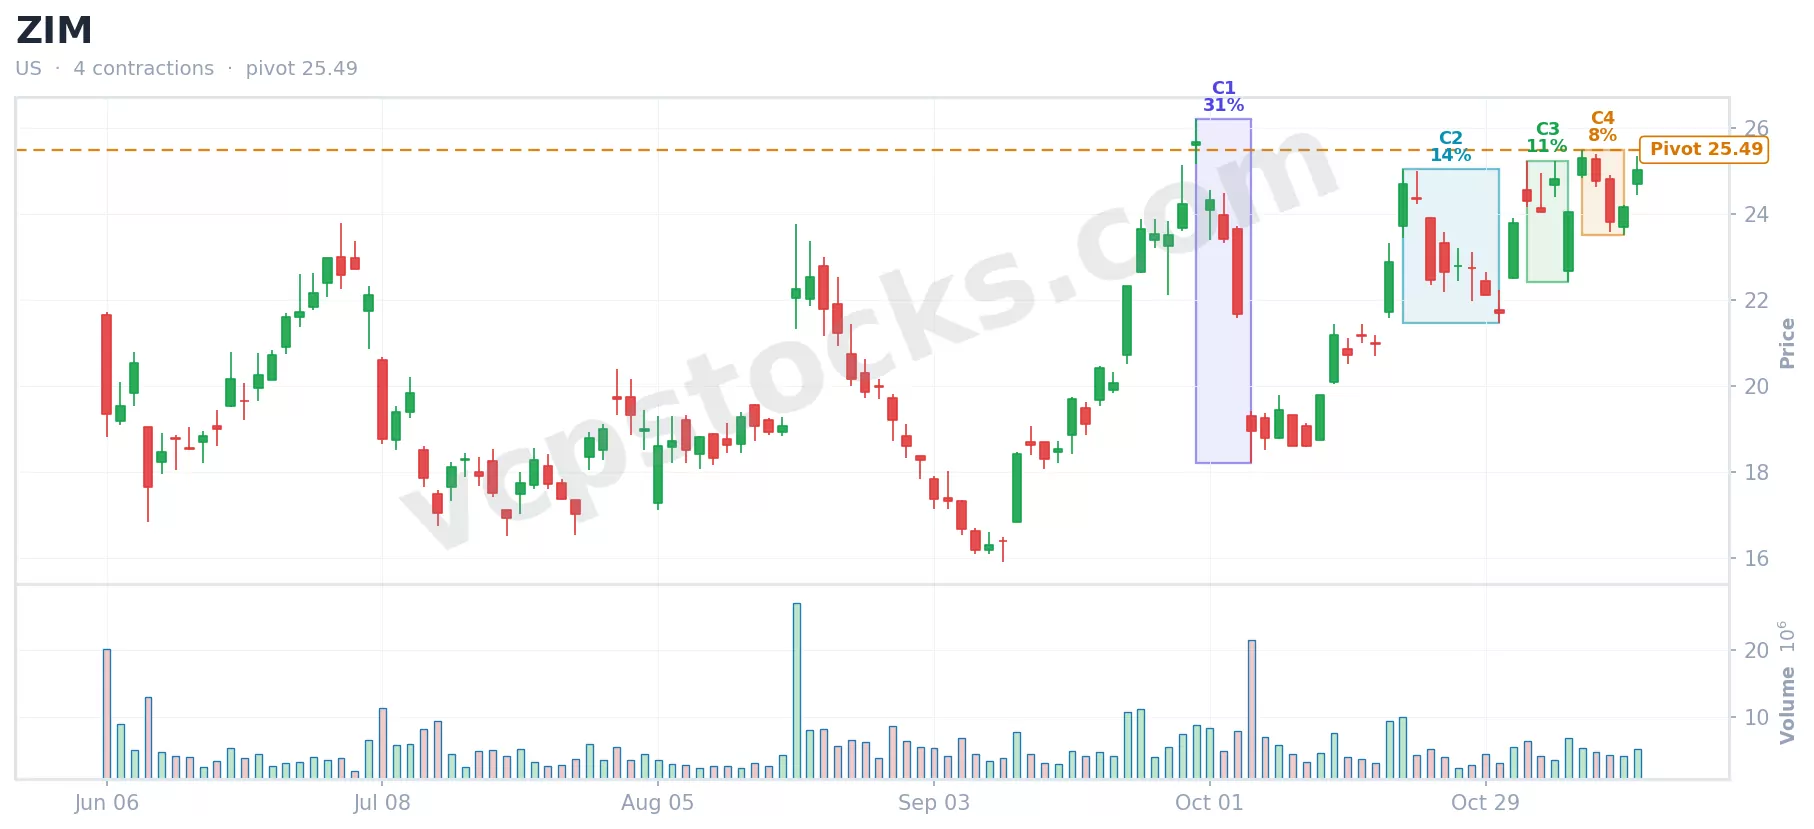
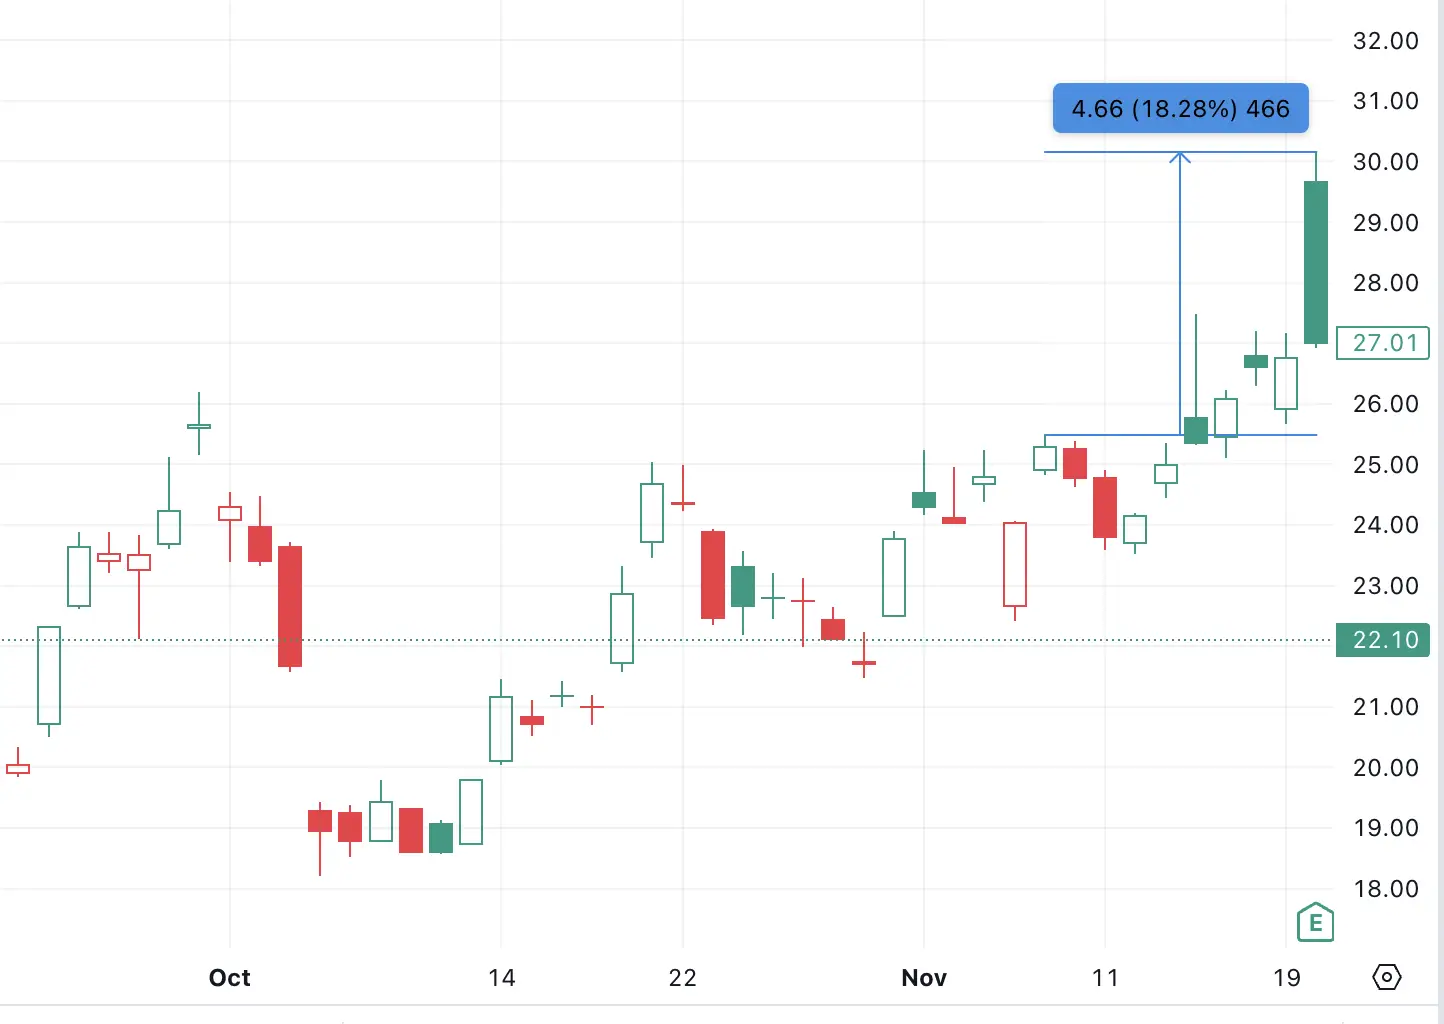
How well VCP stocks can perform after successful breakout
Subscribe to our service plan now!
Basic
- Daily VCP stock charts
- No Weekly VCP stock charts
- Limited to only 1 stock market
- No Stage 2 (Uptrend stage, refer to Mark Minervini's 4 stage analysis) stock list
- No technical analysis & calculation and our customized VCP score rating
Professional
- Daily VCP stock charts
- Weekly VCP stock charts
- Access to ALL available stock markets
- Stage 2 (Uptrend stage, refer to Mark Minervini's 4 stage analysis) stock list
- For each VCP stock chart, we offer some technical analysis & calculation we think it's important for you to make a more precise trading decision (Know More)
- VCP score on each stock chart based on our unique system formula to give you insights on how good we rate the chart's setup
- Stock charts delivered directly to your email address
Want to ask something from us?
Apart from US, India and Taiwan stocks, are there any other stock markets our platform works on?+
Now, our platform works on the US, India and Taiwan stock markets. We hope to extend our services to other stock markets in the future. Please stay tuned.
Which payment methods are accepted for subscription?+
We accept payment via PayPal as well as Visa, Mastercard, American Express, JCB and China UnionPay credit/debit card.
How do I cancel my subscription?+
By subscribing to our service plan, you will need to create an account on our portal. You can manage your subscription status after logging into this portal.
(For Professional Plan users only) Can I just choose to receive scan result on US market only, India market only or Taiwan market only?+
Yes, you can choose to opt out any of the markets in the setting page after logging into our portal.
What time on each trading day can I view the Daily VCP stock charts and stage 2 stock list?+
You can view Daily VCP stock charts in portal after stock market is closed on each trading day.
For US market, normally, the stage 2 stock list will be ready between 00:30 am and 01:30 am in UTC time from Tuesday to Saturday. And the VCP stock charts will be ready between 03:00 am and 04:00 am in UTC time from Tuesday to Saturday.
For India market, normally, the stage 2 stock list will be ready between 01:00 pm and 02:00 pm in UTC time from Monday to Friday. And the VCP stock charts will be ready between 02:00 pm and 03:00 pm in UTC time from Monday to Friday.
For Taiwan market, normally, the stage 2 stock list will be ready between 06:30 am and 07:30 am in UTC time from Monday to Friday. And the VCP stock charts will be ready between 08:00 am and 09:00 am in UTC time from Monday to Friday.
(For Professional Plan users only) What time can I view the Weekly VCP stock charts?+
For US market, you can view Weekly VCP stock charts in portal on each Sunday between 02:15 am and 03:15 am in UTC time.
For India market, you can view Weekly VCP stock charts in portal on each Sunday between 02:00 pm and 03:00 pm in UTC time.
For Taiwan market, the Weekly VCP stock charts are available each Sunday (exact timing to be confirmed).
What is the raw stock data source of the VCP Stock charts?+
We get the raw stock data from well known website TradingView to draw our own VCP stock charts from these data. Therefore, the data is trustworthy and the charts are accurate.
Which stocks will VCP Stocks service check for the Volatility Contraction Pattern and stage 2 list?+
For US stocks, it covers ticker symbols that are listed in TradingView's screener (filtered by market = US, exchange = NASDAQ and NYSE).
For India stocks, it covers ticker symbols that are listed in TradingView's screener (filtered by market = India, exchange = BSE).
For Taiwan stocks, it covers ticker symbols that are listed in TradingView's screener (filtered by market = Taiwan, exchange = TWSE and TPEX).
Remark: We will exclude ETF, Index Fund and Market Index ticker symbols.
What happens if VCP Stocks service is down and I miss the stock charts?+
We understand that service disruptions can be frustrating. If our system experiences downtime on a trading day and you are unable to access the stock charts or stage 2 list, we will compensate you with additional subscription days to make up for the service you missed. The compensation will be automatically applied to your account, and we will notify you via email with details about the adjustment.
Have some questions to ask us?
You can choose to send email to info@vcpstocks.com to make your enquiry or fill out the contact form.