Step-by-Step Guide to Identifying VCP Patterns in Stock Charts
Introduction:
Identifying Volatility Contraction Patterns (VCP) can be a game-changer for traders looking to capitalize on market movements. The VCP pattern, popularized by legendary trader Mark Minervini, signals a potential breakout, making it an essential tool in any trader's arsenal. Here’s a step-by-step guide to help you spot these patterns on your stock charts.
Step 1: Understand the Basics of VCP
Before diving into chart analysis, it's crucial to understand what a VCP pattern looks like. Essentially, a VCP pattern consists of a series of price contractions followed by a breakout. The pattern is characterized by decreasing volatility, where each pullback is smaller than the previous one, indicating reduced selling pressure.
Step 2: Identify the Initial Contraction
Start by looking for a stock that has recently experienced a significant price move. This move should be followed by a pullback or consolidation period. The first contraction is usually the largest and sets the stage for subsequent contractions. On a stock chart, this appears as a sharp decline followed by a period of stabilization.
Step 3: Look for Subsequent Contractions
After the initial contraction, the stock should experience at least two more contractions, each smaller than the last. This series of contractions is crucial to the VCP pattern. Use technical analysis tools to measure these pullbacks and ensure that each one is smaller in both price and volume.
Step 4: Analyze the Volume
Volume plays a critical role in identifying VCP patterns. During each contraction, volume should decrease, indicating that fewer shares are being sold. Conversely, during the rally phases (between contractions), volume should increase, showing buying interest. This decrease in volume during contractions and increase during rallies confirms the pattern.
Step 5: Draw Trendlines
Draw trendlines along the highs and lows of the contractions. These lines should converge, forming a wedge shape. The narrowing of these lines indicates decreasing volatility, a key feature of the VCP pattern. The point where these lines converge is where you should expect a breakout.
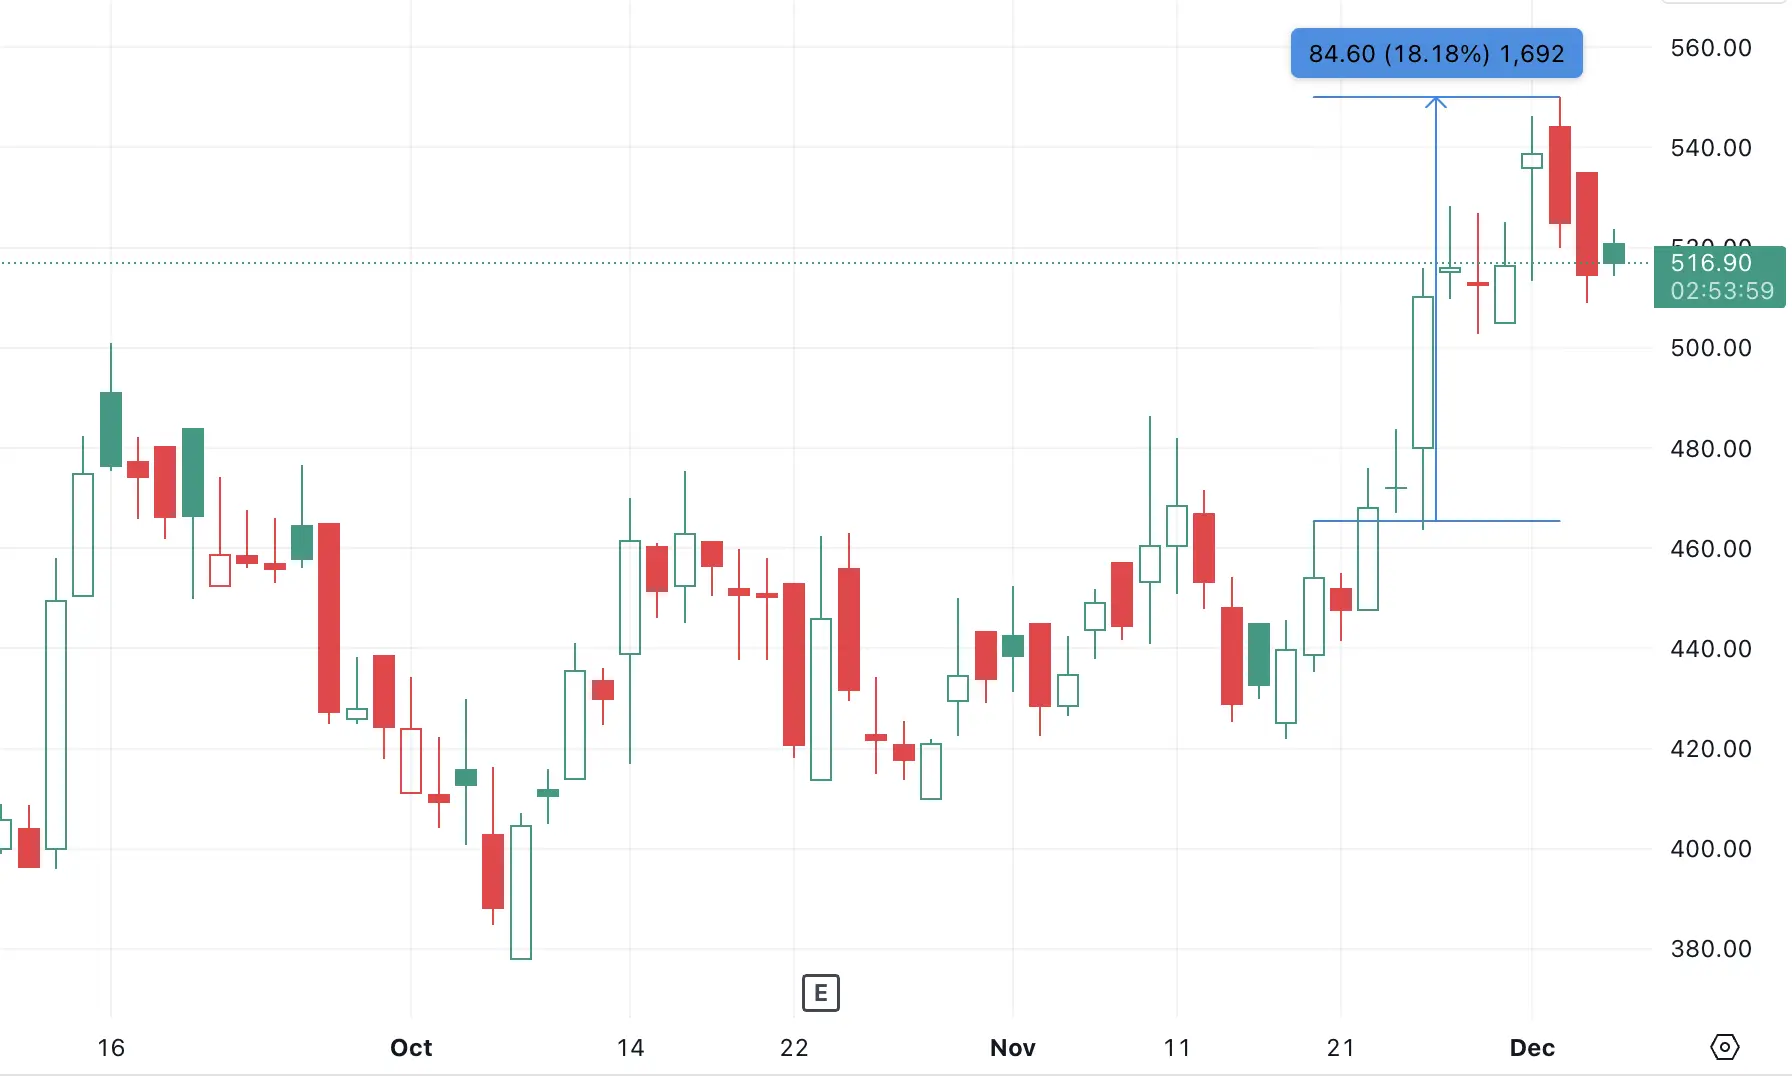
Step 6: Wait for the Breakout
The final and most crucial step is to wait for the breakout. The stock should break above the upper trendline with a significant increase in volume. This breakout confirms the VCP pattern and signals a potential buying opportunity. Ensure the breakout is accompanied by strong volume to validate the move.
Step 7: Manage Your Risk
Like any trading strategy, identifying VCP patterns is not foolproof. Set a stop-loss just below the last contraction to manage your risk. This will protect your capital in case the breakout fails and the stock reverses.
Conclusion:
Identifying VCP patterns requires patience and attention to detail. By following these steps, you can effectively spot potential breakouts and improve your trading strategy. Remember, practice makes perfect. Spend time analyzing historical charts to see how VCP patterns have played out in the past. Happy trading!
Additional Tips:
- Use stock screeners to find potential VCP candidates.
- Combine VCP analysis with other technical indicators for better accuracy.
- Keep an eye on market conditions as they can affect the success of VCP patterns.
By mastering the art of identifying VCP patterns, you can gain a significant edge in the stock market, enabling you to make more informed and profitable trades.